
Bilingual
En/Fa
Geographical Research is Published in both Persian and English Full-text.
Volume 40, Issue 3 (2025)
GeoRes 2025, 40(3): 267-277 |
Back to browse issues page
Article Type:
Subject:


History
Received: 2025/07/31 | Accepted: 2025/09/19 | Published: 2025/10/2
Received: 2025/07/31 | Accepted: 2025/09/19 | Published: 2025/10/2
How to cite this article
Gravand F, Hasani Shah Shahidani E, Fallah Mojaver M, Hejazi S, Kafaei S. Dynamic Role of Vegetation 3D Structure and the Cumulative Effects of Human Threats on the Habitat Suitability of the Caspian Roe Deer. GeoRes 2025; 40 (3) :267-277
URL: http://georesearch.ir/article-1-1846-en.html
URL: http://georesearch.ir/article-1-1846-en.html
Download citation:
BibTeX | RIS | EndNote | Medlars | ProCite | Reference Manager | RefWorks
Send citation to:


Rights and permissions
BibTeX | RIS | EndNote | Medlars | ProCite | Reference Manager | RefWorks
Send citation to:

1- Department of Environment Guilan Province, Rasht, Iran
2- Cohort Center, Guilan University of Medical Sciences, Rasht, Iran
3- Department of Environment Kerman Province, Kerman, Iran
2- Cohort Center, Guilan University of Medical Sciences, Rasht, Iran
3- Department of Environment Kerman Province, Kerman, Iran
Full-Text (HTML) (96 Views)
Background
Habitat degradation and fragmentation in the Hyrcanian forests, especially under human and climatic pressures, have led to a severe decline in the Caspian red deer population. Although species distribution models such as MaxEnt and ENFA are applied, these methods alone are insufficient for a comprehensive analysis of habitat quality, highlighting the need for an integrated approach for more accurate assessment.
Previous Studies
Previous studies have extensively reported the consequences of habitat degradation and fragmentation on biodiversity at structural, functional, and genetic levels. Newbold et al. (2015) and Di Marco et al. (2019) have demonstrated that human activities such as agricultural expansion, logging, and road construction reduce vegetation integrity and lower habitat quality for sensitive forest species. Global studies have also confirmed a significant decline in forest mammal populations due to human pressures; in particular, Dirzo et al. (2014) have estimated that the Caspian red deer population declined by over 80% over a 40-year period.
In the field of ecological niche modeling, research has shown the high accuracy of the MaxEnt model in predicting species distributions and analyzing influential environmental factors (Elith et al., 2011; Phillips et al., 2017). Additionally, Hirzel et al. (2002) have introduced the ENFA model, which allows the analysis of species marginality and specialization without absence data. However, a review of previous studies indicates that most relied on a single model and have paid limited attention to the multidimensional relationships between habitat structure and human pressures (Elith & Leathwick, 2009).
Aim(s)
The present study aimed to provide a comprehensive analytical framework for assessing the habitat suitability of Caspian red deer in the Hyrcanian forests of northern Iran.
Research Type
The present study was descriptive in nature.
Research Society, Place and Time
This study was descriptive and conducted in 2024. The study population comprised three main habitats of the Caspian red deer including Kordmir, Rokouh-Sara, and Gousalekah located in the Fararud area of Rudbar County, Gilan Province. These sites lie on the slopes of the Hyrcanian forests within the Deylaman–Dorfak protected area, recognized as one of the key biodiversity hotspots in northern Iran.
Sampling Method and Number
In this study, data were collected from three main sources. First, a set of specialized questionnaires was distributed among environmental experts and local residents to identify the habitat requirements of the Caspian red deer and the stressors affecting its habitats. Next, field surveys were conducted to measure habitat parameters, including canopy cover density, understory vegetation, food resources, and evidence of species presence. Subsequently, remote sensing data, including Sentinel-2 satellite imagery and topographic parameters, were extracted to provide the environmental layers required for modeling. In total, 43 presence points of the Caspian red deer were processed, with duplicates removed, and used as input for ecological models.
Used Devices & Materials
In this study, a combination of tools and environmental data was used to assess habitat suitability. Sentinel-2 satellite imagery was employed to extract vegetation indices such as NDVI, and topographic data, including elevation, slope, and aspect, were obtained from the USGS Earth Explorer and ESA Copernicus databases. Field measurements were conducted using vegetation assessment tools to record canopy cover density and observe evidence of species presence. Additionally, ArcGIS 10.8 and QGIS 3.26 were used for spatial processing, Biomapper 4.0 for running the ENFA model, MaxEnt 3.4.4 for predicting species distribution, and SPSS 26 for statistical analyses. Furthermore, data obtained from specialized questionnaires were incorporated as key inputs in the analyses.
Findings
In this study, the evaluation of six habitat parameters and six stress factors across the three habitats including Gousalekah , Kordmir, and Rokouh-Sara revealed significant differences in habitat quality and human pressure. Gousalekah performed best in most vegetation indices, food resources, and forest structure, Kordmir was intermediate, and Rokouh-Sara had the lowest quality (Tables 1 and 2). Analysis of human factors showed that Gousalekah experienced minimal exploitation, livestock density, and waste, while being farthest from human settlements; in contrast, Kordmir and Rokouh-Sara were under higher human pressure (Table 1). Structural vegetation features indicated that Gousalekah had dense canopy and understory, a four-layered structure, and high diversity of edible species, making it the most suitable habitat (Table 2).
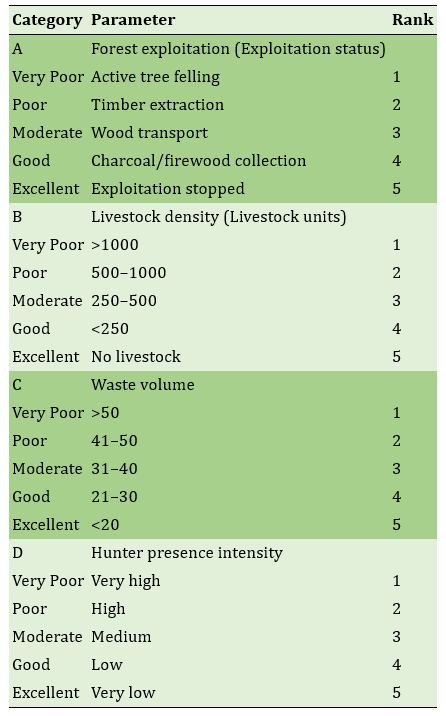
Table 1) Ranking of stressor factors
The Habitat Evaluation Procedure (HEP) matrices showed Gousalekah with the highest habitat suitability score (26/30) and lowest human stress (28), followed by Kordmir and Rokouh-Sara (Tables 3 and 4). Combining these matrices in HEP ranked Gousalekah as high suitability (54), Kordmir as medium (43), and Rokouh-Sara as low (34; Figure 1). The Habitat Suitability Index (HSI) values confirmed this pattern: 0.86 for Gusaleh-Gah, 0.73 for Kordmir, and 0.36 for Rokuh-Sara (Figure 2). Spatial HSI mapping indicated that 25% of the area was high suitability, 55% medium, and 20% low, consistent with the three habitat conditions (Figure 3). Sensitivity analysis identified canopy cover (SIV5) and understory (SIV2) as the most influential parameters, contributing 40–42% and 33–36% to HSI variance (Figure 4).
Table 3) Habitat requirements matrix
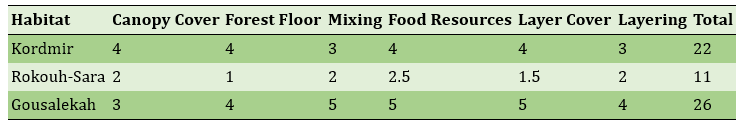
Table 4) Stressor factors matrix
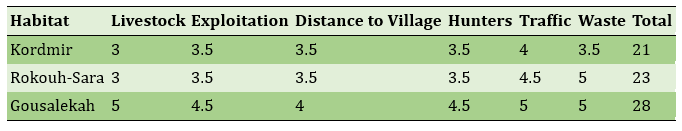
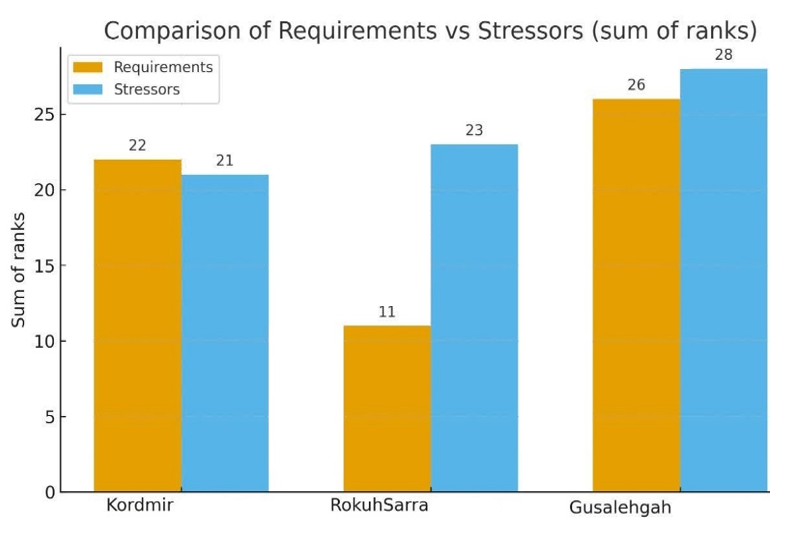
Figure 1) Total Scores of Habitat Requirements and Stressor Factors
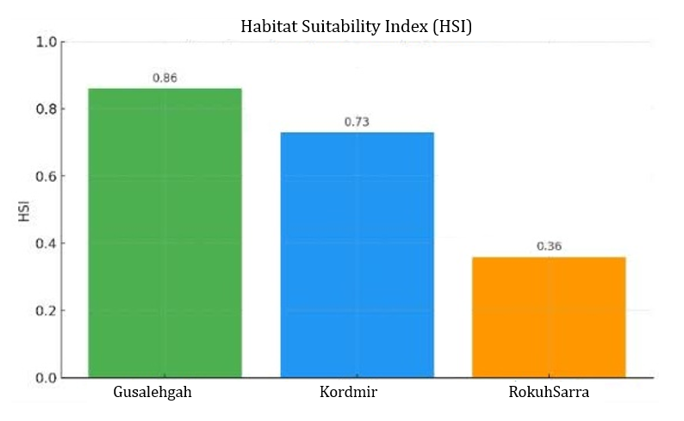
Figure 2) Habitat Suitability Index (HSI) profiles in three habitats
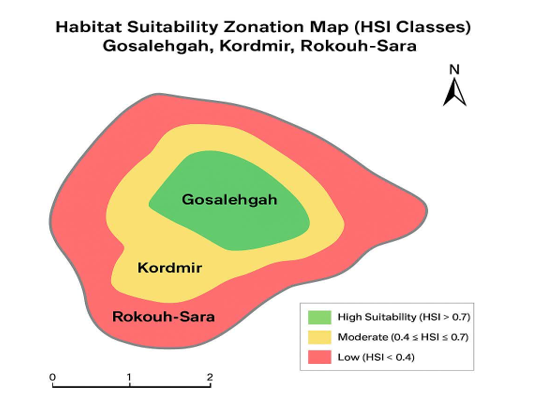
Figure 3) Habitat suitability zoning map
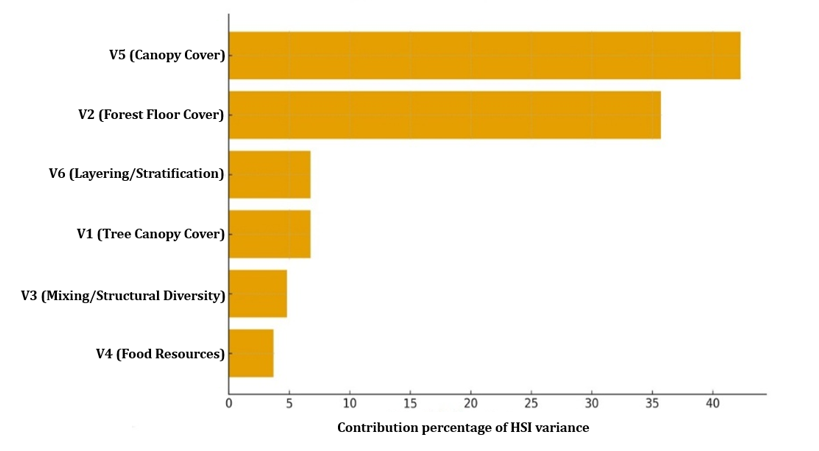
Figure 4) Sensitivity analysis of parameters
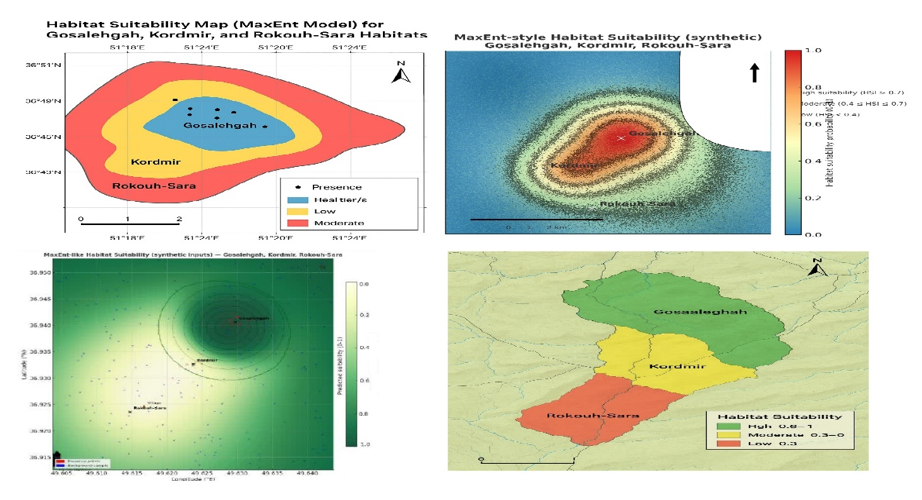
Figure 5) MaxEnt Map, evaluation of Caspian Red Deer habitat suitability
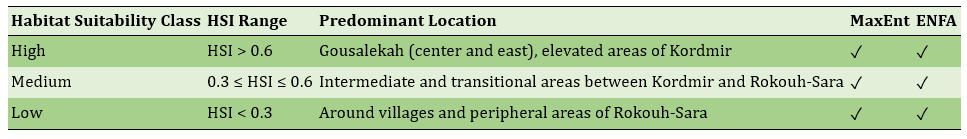
Modeling results from MaxEnt demonstrated high accuracy (AUC = 0.91), with NDVI (34%), canopy cover (25%), and distance from villages (18%) being key predictors (Table5; Figure 5). ENFA results (Tables 6 and 7, ENFA map) reported Marginality=0.72, Specialization=1.90, and Boyce index=0.74, highlighting NDVI and village distance as critical factors. Table 8 shows strong agreement between MaxEnt and ENFA in identifying high-suitability areas in Gousalekah and Kordmir and overlapping medium and low zones.
Table 5) Relative Importance of Environmental Parameters in the MaxEnt Model for Caspian Red Deer
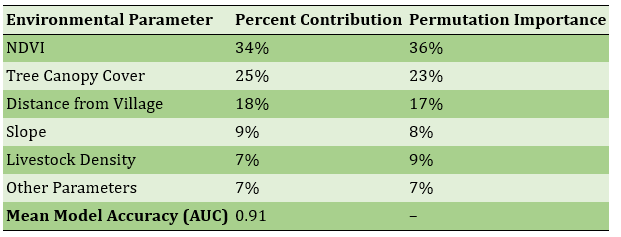
Table 6) Ecological indices derived from the ENFA model for Caspian red deer
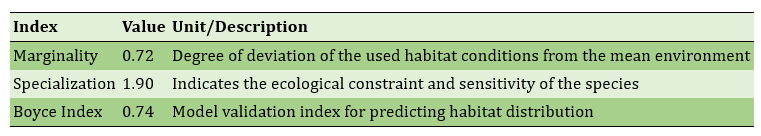
Table 7) Relative contribution of parameters to marginality and specialization in the ENFA Model
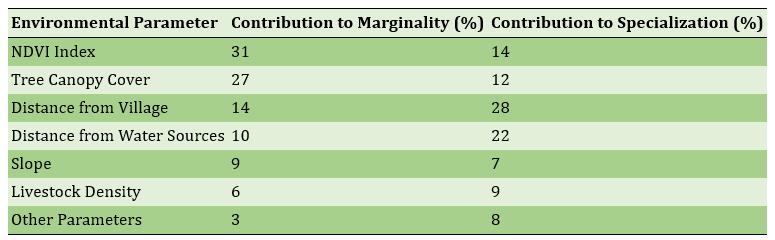
Table 8) Spatial classification of habitats based on MaxEnt and ENFA outputs
Main Comparisons to Similar Studies
Compared to similar studies, the findings of this research emphasize that Chamois habitat suitability is not determined solely by environmental parameters but is primarily shaped by the complex interaction between three-dimensional vegetation structure and human pressures [Bobrowski et al., 2020; Stritih et al., 2024; Schwegmann et al., 2023]. Consistent with other research, human pressures such as livestock density, forest exploitation, and proximity to settlements cumulatively reduce the species’ habitat capacity [Araújo et al., 2019; Brooks et al., 2019; Nogueira et al., 2021]. Multi-model analyses (MaxEnt and ENFA) have demonstrated that Chamois are sensitive to optimal habitat conditions, and the presence of food resources and shelter maintains its habitat value only under reduced human disturbance [Pourmosa et al., 2024; Champagne et al., 2021]. Structural parameters, particularly canopy and understory cover, had the greatest influence on HSI, aligning with previous studies on managing specialized habitats and structural restoration [Mahmoodi et al., 2020; Evcin et al., 2019; Valavi et al., 2022]. This research, particularly through integrating multi-modeling approaches and human pressure analyses, provides a more comprehensive framework for managing sensitive habitats and is consistent with prior studies on the sensitivity of specialist species and the importance of synergy between habitat structure and human pressures [Iverson et al., 2023; Kass et al., 2021; Margules & Pressey, 2000].
Suggestions
In future studies, integrating remote-sensing data, genetic sampling, and population monitoring could enhance the explanatory power of models and enable the assessment of both seasonal and interannual heterogeneity. The success of Chamois conservation depends on the synergy between structural restoration measures and the reduction of human pressures. This synergy should be implemented through a regional program that prioritizes actions based on habitat value and restoration potential, and allocates conservation resources strategically. Accordingly, a combination of interventions at local levels (livestock grazing control, protection of seedling areas), regional levels (designing conservation networks and ecological corridors), and policy levels (regulating resource use and engaging local communities) can increase the likelihood of successful conservation outcomes.
Conclusion
The Chamois selects its habitat not based on simple habitat criteria, but according to the "three-dimensional structural complexity of the forest."
Acknowledgments: None reported by the authors.
Ethical Approval: This study is an analytical investigation and did not require ethical approval from relevant authorities.
Conflict of Interest: The authors declare that there are no financial or personal conflicts of interest related to the content of this article.
Authors’ Contributions: Gravand F (first author), Introduction Writer/Methodology/Statistical Analyst/Discussion Writer (38%); Hasani Shah Shahidani E (second author), Introduction Writer/Discussion Writer (15%); Fallah Majavor M (third author), Introduction Writer/Discussion Writer (15%); Hejazi SA (fourth author), Introduction Writer/Statistical Analyst/Discussion Writer(10%); Kafaei S (fifth author), Introduction Writer/Statistical Analyst/Discussion Writer (22%)
Funding: This research did not receive any specific financial support, and all costs were covered by the authors.
Habitat degradation and fragmentation in the Hyrcanian forests, especially under human and climatic pressures, have led to a severe decline in the Caspian red deer population. Although species distribution models such as MaxEnt and ENFA are applied, these methods alone are insufficient for a comprehensive analysis of habitat quality, highlighting the need for an integrated approach for more accurate assessment.
Previous Studies
Previous studies have extensively reported the consequences of habitat degradation and fragmentation on biodiversity at structural, functional, and genetic levels. Newbold et al. (2015) and Di Marco et al. (2019) have demonstrated that human activities such as agricultural expansion, logging, and road construction reduce vegetation integrity and lower habitat quality for sensitive forest species. Global studies have also confirmed a significant decline in forest mammal populations due to human pressures; in particular, Dirzo et al. (2014) have estimated that the Caspian red deer population declined by over 80% over a 40-year period.
In the field of ecological niche modeling, research has shown the high accuracy of the MaxEnt model in predicting species distributions and analyzing influential environmental factors (Elith et al., 2011; Phillips et al., 2017). Additionally, Hirzel et al. (2002) have introduced the ENFA model, which allows the analysis of species marginality and specialization without absence data. However, a review of previous studies indicates that most relied on a single model and have paid limited attention to the multidimensional relationships between habitat structure and human pressures (Elith & Leathwick, 2009).
Aim(s)
The present study aimed to provide a comprehensive analytical framework for assessing the habitat suitability of Caspian red deer in the Hyrcanian forests of northern Iran.
Research Type
The present study was descriptive in nature.
Research Society, Place and Time
This study was descriptive and conducted in 2024. The study population comprised three main habitats of the Caspian red deer including Kordmir, Rokouh-Sara, and Gousalekah located in the Fararud area of Rudbar County, Gilan Province. These sites lie on the slopes of the Hyrcanian forests within the Deylaman–Dorfak protected area, recognized as one of the key biodiversity hotspots in northern Iran.
Sampling Method and Number
In this study, data were collected from three main sources. First, a set of specialized questionnaires was distributed among environmental experts and local residents to identify the habitat requirements of the Caspian red deer and the stressors affecting its habitats. Next, field surveys were conducted to measure habitat parameters, including canopy cover density, understory vegetation, food resources, and evidence of species presence. Subsequently, remote sensing data, including Sentinel-2 satellite imagery and topographic parameters, were extracted to provide the environmental layers required for modeling. In total, 43 presence points of the Caspian red deer were processed, with duplicates removed, and used as input for ecological models.
Used Devices & Materials
In this study, a combination of tools and environmental data was used to assess habitat suitability. Sentinel-2 satellite imagery was employed to extract vegetation indices such as NDVI, and topographic data, including elevation, slope, and aspect, were obtained from the USGS Earth Explorer and ESA Copernicus databases. Field measurements were conducted using vegetation assessment tools to record canopy cover density and observe evidence of species presence. Additionally, ArcGIS 10.8 and QGIS 3.26 were used for spatial processing, Biomapper 4.0 for running the ENFA model, MaxEnt 3.4.4 for predicting species distribution, and SPSS 26 for statistical analyses. Furthermore, data obtained from specialized questionnaires were incorporated as key inputs in the analyses.
Findings
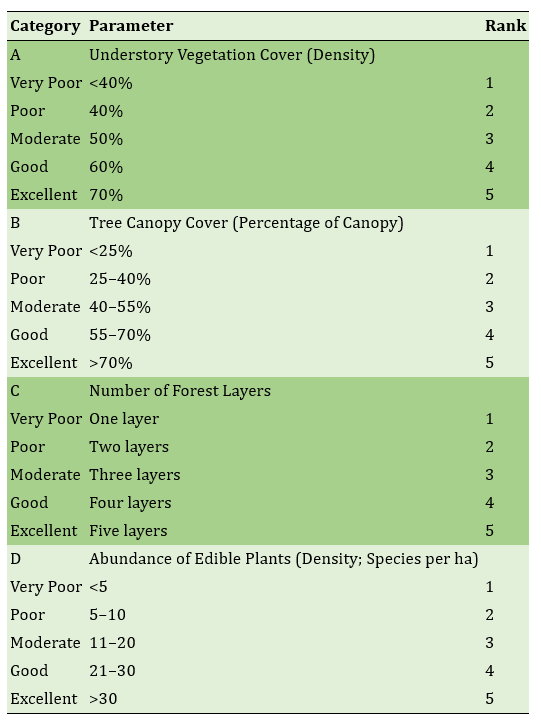
In this study, the evaluation of six habitat parameters and six stress factors across the three habitats including Gousalekah , Kordmir, and Rokouh-Sara revealed significant differences in habitat quality and human pressure. Gousalekah performed best in most vegetation indices, food resources, and forest structure, Kordmir was intermediate, and Rokouh-Sara had the lowest quality (Tables 1 and 2). Analysis of human factors showed that Gousalekah experienced minimal exploitation, livestock density, and waste, while being farthest from human settlements; in contrast, Kordmir and Rokouh-Sara were under higher human pressure (Table 1). Structural vegetation features indicated that Gousalekah had dense canopy and understory, a four-layered structure, and high diversity of edible species, making it the most suitable habitat (Table 2).
Table 1) Ranking of stressor factors
The Habitat Evaluation Procedure (HEP) matrices showed Gousalekah with the highest habitat suitability score (26/30) and lowest human stress (28), followed by Kordmir and Rokouh-Sara (Tables 3 and 4). Combining these matrices in HEP ranked Gousalekah as high suitability (54), Kordmir as medium (43), and Rokouh-Sara as low (34; Figure 1). The Habitat Suitability Index (HSI) values confirmed this pattern: 0.86 for Gusaleh-Gah, 0.73 for Kordmir, and 0.36 for Rokuh-Sara (Figure 2). Spatial HSI mapping indicated that 25% of the area was high suitability, 55% medium, and 20% low, consistent with the three habitat conditions (Figure 3). Sensitivity analysis identified canopy cover (SIV5) and understory (SIV2) as the most influential parameters, contributing 40–42% and 33–36% to HSI variance (Figure 4).
Table 3) Habitat requirements matrix
Table 4) Stressor factors matrix
Figure 1) Total Scores of Habitat Requirements and Stressor Factors
Figure 2) Habitat Suitability Index (HSI) profiles in three habitats
Figure 3) Habitat suitability zoning map
Figure 4) Sensitivity analysis of parameters
Figure 5) MaxEnt Map, evaluation of Caspian Red Deer habitat suitability
Modeling results from MaxEnt demonstrated high accuracy (AUC = 0.91), with NDVI (34%), canopy cover (25%), and distance from villages (18%) being key predictors (Table5; Figure 5). ENFA results (Tables 6 and 7, ENFA map) reported Marginality=0.72, Specialization=1.90, and Boyce index=0.74, highlighting NDVI and village distance as critical factors. Table 8 shows strong agreement between MaxEnt and ENFA in identifying high-suitability areas in Gousalekah and Kordmir and overlapping medium and low zones.
Table 5) Relative Importance of Environmental Parameters in the MaxEnt Model for Caspian Red Deer
Table 6) Ecological indices derived from the ENFA model for Caspian red deer
Table 7) Relative contribution of parameters to marginality and specialization in the ENFA Model
Table 8) Spatial classification of habitats based on MaxEnt and ENFA outputs
Main Comparisons to Similar Studies
Compared to similar studies, the findings of this research emphasize that Chamois habitat suitability is not determined solely by environmental parameters but is primarily shaped by the complex interaction between three-dimensional vegetation structure and human pressures [Bobrowski et al., 2020; Stritih et al., 2024; Schwegmann et al., 2023]. Consistent with other research, human pressures such as livestock density, forest exploitation, and proximity to settlements cumulatively reduce the species’ habitat capacity [Araújo et al., 2019; Brooks et al., 2019; Nogueira et al., 2021]. Multi-model analyses (MaxEnt and ENFA) have demonstrated that Chamois are sensitive to optimal habitat conditions, and the presence of food resources and shelter maintains its habitat value only under reduced human disturbance [Pourmosa et al., 2024; Champagne et al., 2021]. Structural parameters, particularly canopy and understory cover, had the greatest influence on HSI, aligning with previous studies on managing specialized habitats and structural restoration [Mahmoodi et al., 2020; Evcin et al., 2019; Valavi et al., 2022]. This research, particularly through integrating multi-modeling approaches and human pressure analyses, provides a more comprehensive framework for managing sensitive habitats and is consistent with prior studies on the sensitivity of specialist species and the importance of synergy between habitat structure and human pressures [Iverson et al., 2023; Kass et al., 2021; Margules & Pressey, 2000].
Suggestions
In future studies, integrating remote-sensing data, genetic sampling, and population monitoring could enhance the explanatory power of models and enable the assessment of both seasonal and interannual heterogeneity. The success of Chamois conservation depends on the synergy between structural restoration measures and the reduction of human pressures. This synergy should be implemented through a regional program that prioritizes actions based on habitat value and restoration potential, and allocates conservation resources strategically. Accordingly, a combination of interventions at local levels (livestock grazing control, protection of seedling areas), regional levels (designing conservation networks and ecological corridors), and policy levels (regulating resource use and engaging local communities) can increase the likelihood of successful conservation outcomes.
Conclusion
The Chamois selects its habitat not based on simple habitat criteria, but according to the "three-dimensional structural complexity of the forest."
Acknowledgments: None reported by the authors.
Ethical Approval: This study is an analytical investigation and did not require ethical approval from relevant authorities.
Conflict of Interest: The authors declare that there are no financial or personal conflicts of interest related to the content of this article.
Authors’ Contributions: Gravand F (first author), Introduction Writer/Methodology/Statistical Analyst/Discussion Writer (38%); Hasani Shah Shahidani E (second author), Introduction Writer/Discussion Writer (15%); Fallah Majavor M (third author), Introduction Writer/Discussion Writer (15%); Hejazi SA (fourth author), Introduction Writer/Statistical Analyst/Discussion Writer(10%); Kafaei S (fifth author), Introduction Writer/Statistical Analyst/Discussion Writer (22%)
Funding: This research did not receive any specific financial support, and all costs were covered by the authors.
References
1. Araújo MB, Anderson RP, Márcia Barbosa A, Beale CM, Dormann CF, Early R, et al (2019). Standards for distribution models in biodiversity assessments. Science Advances. 5(1):eaat4858. [Link] [DOI:10.1126/sciadv.aat4858]
2. Benítez-López A, Alkemade R, Verweij PA (2010). The impacts of roads and other infrastructure on mammal and bird populations: A meta-analysis. Biological Conservation. 143(6):1307-1316. [Link] [DOI:10.1016/j.biocon.2010.02.009]
3. Bobrowski M, Gillich B, Stolter C (2020). Nothing else matters? Food as a driving factor of habitat use by red and roe deer in winter?. Wildlife Biology. 2020(4):1-9. [Link] [DOI:10.2981/wlb.00723]
4. Brooks T, Pimm SL, Akçakaya HR, Buchanan G, Butchart SH, Foden W, et al (2019). Measuring terrestrial area of habitat (AOH) and its utility for the IUCN Red List. Trends in Ecology & Evolution. 34(11):977-986. [Link] [DOI:10.1016/j.tree.2019.06.009]
5. Champagne E, Raymond P, Royo AA, Speed JD, Tremblay JP, Côté SD (2021). A review of ungulate impacts on the success of climate-adapted forest management strategies. Current Forestry Reports. 7(4):305-320. [Link] [DOI:10.1007/s40725-021-00148-5]
6. Côté SD, Rooney TP, Tremblay JP, Dussault C, Waller DM (2004). Ecological impacts of deer overabundance. Annual Review of Ecology, Evolution, and Systematics. 35(1):113-147. [Link] [DOI:10.1146/annurev.ecolsys.35.021103.105725]
7. Di Marco M, Ferrier S, Harwood TD, Hoskins AJ, Watson JE (2019). Wilderness areas halve the extinction risk of terrestrial biodiversity. Nature. 573:582-585. [Link] [DOI:10.1038/s41586-019-1567-7]
8. Dirzo R, Young HS, Galetti M, Ceballos G, Isaac NJ, Collen B (2014). Defaunation in the anthropocene. Science. 345(6195):401-406. [Link] [DOI:10.1126/science.1251817]
9. Drusch M, Del Bello U, Carlier S, Colin O, Fernandez V, Gascon F, et al (2012). Sentinel-2: ESA's optical high-resolution mission for GMES operational services. Remote Sensing of Environment. 120:25-36. [Link] [DOI:10.1016/j.rse.2011.11.026]
10. Elith J, Leathwick JR (2009). Species distribution models: Ecological explanation and prediction across space and time. Annual Review of Ecology, Evolution, and Systematics. 40(1):677-697. [Link] [DOI:10.1146/annurev.ecolsys.110308.120159]
11. Elith J, Phillips SJ, Hastie T, Dudík M, Chee YE, Yates CJ (2011). A statistical explanation of MaxEnt for ecologists. Diversity and Distributions. 17(1):43-57. [Link] [DOI:10.1111/j.1472-4642.2010.00725.x]
12. Evcin O, Kucuk O, Akturk E (2019). Habitat suitability model with maximum entropy approach for European roe deer (Capreolus capreolus) in the Black Sea Region. Environmental Monitoring and Assessment. 191(11):669. [Link] [DOI:10.1007/s10661-019-7853-x]
13. Forkuor G, Hounkpatin OK, Welp G, Thiel M (2017). High resolution mapping of soil properties using remote sensing parameters in south-western Burkina Faso: A comparison of machine learning and multiple linear regression models. PLoS One. 12(1):e0170478. [Link] [DOI:10.1371/journal.pone.0170478]
14. Hirzel AH, Hausser J, Chessel D, Perrin N (2002). Ecological-niche factor analysis: How to compute habitat-suitability maps without absence data?. Ecology. 83(7):2027-2036. [Link] [DOI:10.1890/0012-9658(2002)083[2027:ENFAHT]2.0.CO;2]
15. Iverson AR, Humple DL, Cormier RL, Hull J (2023). Land cover and NDVI are important predictors in habitat selection along migration for the Golden-crowned Sparrow, a temperate-zone migrating songbird. Movement Ecology. 11(1):2. [Link] [DOI:10.1186/s40462-022-00353-2]
16. Kass JM, Muscarella R, Galante PJ, Bohl CL, Pinilla-Buitrago GE, Boria RA, et al (2021). ENMeval 2.0: Redesigned for customizable and reproducible modeling of species' niches and distributions. Methods in Ecology and Evolution. 12(9):1602-1608. [Link] [DOI:10.1111/2041-210X.13628]
17. Mahmoodi S, Alizadeh Shabani A, Zeinalabedini M, Khalilipour O, Ashrafi S (2020). Identifying habitat patches and suitability for roe deer, Capreolus capreolus as a protected species in Iran. Caspian Journal of Environmental Sciences. 18(4):357-366. [Link]
18. Margules CR, Pressey RL (2000). Systematic conservation planning. Nature. 405:243-253. [Link] [DOI:10.1038/35012251]
19. Melis C, Jędrzejewska B, Apollonio M, Bartoń KA, Jędrzejewski W, Linnell JD, et al (2009). Predation has a greater impact in less productive environments: Variation in roe deer, Capreolus capreolus, population density across Europe. Global Ecology and Biogeography. 18(6):724-734. [Link] [DOI:10.1111/j.1466-8238.2009.00480.x]
20. Newbold T, Hudson LN, Hill SL, Contu S, Lysenko I, Senior RA, et al (2015). Global effects of land use on local terrestrial biodiversity. Nature. 520:45-50. [Link] [DOI:10.1038/nature14324]
21. Nogueira OMA, Palmeirim AF, Peres CA, Dos Santos-Filho M (2021). Synergistic effects of habitat configuration and land-use intensity shape the structure of bird assemblages in human-modified landscapes across three major neotropical biomes. Biodiversity and Conservation. 30:3793-3811. [Link] [DOI:10.1007/s10531-021-02275-8]
22. Phillips SJ, Anderson RP, Dudík M, Schapire RE, Blair ME (2017). Opening the black box: An open-source release of Maxent. Ecography. 40(7):887-893. [Link] [DOI:10.1111/ecog.03049]
23. Phillips SJ, Anderson RP, Schapire RE (2006). Maximum entropy modeling of species geographic distributions. Ecological Modelling. 190(3-4):231-259. [Link] [DOI:10.1016/j.ecolmodel.2005.03.026]
24. Pourmosa H, Ghasempouri M, Mahini AS, Rezaei H (2024). Habitat suitability modeling of the Caspian Red Deer (Cervus elaphus Maral) in the central zone of the Hyrcanian region: Identification of priority conservation areas. Journal of Wildlife and Biodiversity. 8(4):148-172. [Link] [DOI:10.21203/rs.3.rs-7727446/v1]
25. Ripple WJ, Newsome TM, Wolf C, Dirzo R, Everatt KT, Galetti M, et al (2015). Collapse of the world's largest herbivores. Science Advances. 1(4):e1400103. [Link] [DOI:10.1126/sciadv.1400103]
26. Schwegmann S, Mörsdorf M, Bhardwaj M, Storch I (2023). Effects of understory characteristics on browsing patterns of roe deer in central European mountain forests. Ecology and Evolution. 13(8):e10431. [Link] [DOI:10.1002/ece3.10431]
27. Stritih A, Senf C, Kuemmerle T, Munteanu C, Dzadzamia L, Stritih J, et al (2024). Same, but different: Similar states of forest structure in temperate mountain regions of Europe despite different social-ecological forest disturbance regimes. Landscape Ecology. 39(6):114. [Link] [DOI:10.1007/s10980-024-01908-x]
28. Talebi KS, Sajedi T, Pourhashemi M (2014). Forests of Iran: A treasure from the past, a hope for the future. Dordrecht: Springer. [Link] [DOI:10.1007/978-94-007-7371-4]
29. USFWS (1980). Habitat Evaluation Procedures (HEP) [Internet]. Washington, D.C.: U.S. Fish and Wildlife Service [cited 2024 May 12th]. Available from: https://www.fws.gov/policy-library/870fw1. [Link]
30. Valavi R, Guillera-Arroita G, Lahoz-Monfort JJ, Elith J (2022). Predictive performance of presence-only species distribution models: A benchmark study with reproducible code. Ecological Monographs. 92(1):e01486. [Link] [DOI:10.1002/ecm.1486]