
Bilingual
En/Fa
Geographical Research is Published in both Persian and English Full-text.
Volume 38, Issue 4 (2023)
GeoRes 2023, 38(4): 445-458 |
Back to browse issues page
Article Type:
Subject:


History
Received: 2023/09/18 | Accepted: 2023/10/14 | Published: 2023/10/28
Received: 2023/09/18 | Accepted: 2023/10/14 | Published: 2023/10/28
How to cite this article
Ahar H, Zanganeh A, Khaksari Rafsanjani A, Karami T. The Effects of Urban Transportation Infrastructures on the Spatio-temporal Growth of Tehran Metropolitan Area. GeoRes 2023; 38 (4) :445-458
URL: http://georesearch.ir/article-1-1527-en.html
URL: http://georesearch.ir/article-1-1527-en.html
Download citation:
BibTeX | RIS | EndNote | Medlars | ProCite | Reference Manager | RefWorks
Send citation to:


Rights and permissions
BibTeX | RIS | EndNote | Medlars | ProCite | Reference Manager | RefWorks
Send citation to:

1- Department of Human Geography, Faculty of Geographical Sciences, Kharazmi University, Tehran, Iran
2- Department of Urban Planning and Regional Development, Faculty of Social Sciences, Allameh Tabatabai University, Tehran, Iran
2- Department of Urban Planning and Regional Development, Faculty of Social Sciences, Allameh Tabatabai University, Tehran, Iran
Full-Text (HTML) (601 Views)
Introduction
The analysis of factors influencing urban growth and expansion has been one of the key topics in urban geography in recent years [Aïkous et al., 2023; Aliakbari et al., 2021; Bosch et al., 2020; Dadashpoor & Ahani, 2019; Dahal et al., 2017; Galster et al., 2001]. Monitoring the process of urban growth for its proper management and control, particularly in metropolitan areas, necessitates examining the driving forces of urban growth and their components across different time periods [Dahal et al., 2017; Taubenbock et al., 2014; Bhatta, 2010]. This analytical framework is commonly referred to as spatio-temporal urban growth.
In the theoretical literature of urban geography, urban growth is a fundamental and comprehensive concept, defined as the transformation of land into built environments, and often used interchangeably with urbanization [Dahal et al., 2017]. Urban growth has also been described as the process of outward expansion of urban centers [Dadras et al., 2015]. Accordingly, spatio-temporal patterns of urban growth refer to the spatial characteristics of urban land within a specific geographical context over time [Dahal et al., 2017]. In general, analyzing spatio-temporal patterns of urban growth requires consideration of three essential dimensions: the location of growth, the magnitude of growth, and the timing of growth [Bosch et al., 2020; Bhatta, 2010].
To date, researchers in urban studies have investigated the roles of various natural, social, political, and economic factors in urban growth. However, transportation-related components have received relatively less attention, despite being among the most critical driving forces of urban growth [Aïkous et al., 2023; Perveen et al., 2018; Aljoufie et al., 2013; Bhatta, 2010]. Urban transportation generally refers to the movement of people and goods within and between cities [Rodrigue, 2020]. As a key component of urban communication systems, it facilitates mobility and accessibility between land uses and enables the flow of people and goods across urban spaces [Garrett, 2014].
The relationship between transportation and urban growth suggests that urbanization is fundamentally shaped by transport infrastructures such as roads, transit systems, and pedestrian networks. Urban transportation infrastructure, by attracting people and labor forces, provides a strong driver for urban expansion [Pokharel et al., 2021]. Since each city follows a unique temporal trajectory in the accumulation and development of transportation infrastructure, diverse urban forms, spatial structures, and corresponding transportation systems can be identified [Rodrigue, 2020]. Examples of these spatial structures include compact versus dispersed, monocentric versus polycentric, and linear versus radial forms, which emerge largely through the direct impact of transportation components on urban growth [Rodrigue, 2020; Hashemi, 2021; Muñiz & Garcia-López, 2019].
Among urban transportation infrastructures, highways play a particularly significant role in shaping urban growth. Since the 1950s, highways have functioned as catalysts of urban economic development, creating new opportunities and multiple competitive advantages for firms, individuals, and households [Canales et al., 2019; Credit, 2019; Higgins et al., 2014]. These advantages largely stem from two main factors: enhanced accessibility and reduced transportation costs, which are considered the major benefits of highways compared to other transport modes [Aïkous et al., 2023; Percoco, 2016; Bhatta, 2010; Baum-Snow, 2007]. Empirical evidence shows that highways have had at least three major impacts on urban growth: (1) encouraging suburbanization; (2) reducing population density in central cities; and (3) increasing population and economic activities in peripheral areas [Garcia-Lo´pez et al., 2015; Baum-Snow, 2007].
For instance, Percoco [2016] demonstrated that the location of highway exits in Italy over the 1951–2001 period significantly influenced employment, population growth, and industrial expansion, particularly in transport-related services. Highway infrastructure increases the likelihood of industrial and commercial development in surrounding areas, and such growth often persists even when governments attempt to restrict it through regulatory measures [Aïkous et al., 2023]. Levkovich et al. [2020] found that highways, by fostering population growth in peripheral areas, generated a leapfrog growth pattern, whereby suburban expansion bypasses development constraints and extends into more distant peripheries. Similarly, studies in the United States have shown that newly constructed beltways influenced urban development patterns by attracting office complexes, commercial establishments, and multi-family housing projects along their corridors [Nechyba & Walsh, 2004].
With respect to accessibility, studies by Bhatta and Drennan [2003] and Giuliano [2004] indicated that highway investments increase accessibility to various destinations, with the greatest benefits concentrated at or near the sites of investment. However, negative consequences of highways on certain aspects of urban development have also been reported. For example, Haider and Miller [2000] found that residential proximity to highways in Toronto led to reduced housing values due to noise and traffic-related disturbances. Similarly, Kim et al. [2007] revealed that in Seoul, every 1% increase in highway traffic noise was associated with a 3.1% decline in land values.
Overall, the review of existing studies highlights the reciprocal relationship between urban transportation infrastructure and land-use systems. Nonetheless, much of the literature has emphasized the role of land use in shaping transportation systems, while the reverse relationship, how transportation drives urban growth has received comparatively less attention. Against this backdrop, the present study investigates the role of urban highways, as one of the most critical transportation infrastructures, in shaping key dimensions of urban growth and expansion in Tehran between 1996 and 2021.
As Iran’s political and economic capital, the metropolis of Tehran currently faces severe urban transportation challenges manifested in traffic congestion, high population density, and environmental pollution [Bakhshi & Daryabari, 2020]. Due to its spatial structure, Tehran is essentially a car-dependent city [Ahar et al., 2022], and the impact of this auto-oriented pattern on uncontrolled urban sprawl is evident [Talkhabi et al., 2022]. Meanwhile, the city’s public transportation fleet has become increasingly obsolete due to insufficient investment and modernization, thereby aggravating its negative environmental consequences [Alizadeh et al., 2023]. In light of these challenges, and the urgent need for appropriate transportation policies to manage and control Tehran’s urban growth, the objective of this study is to analyze the influence of urban highways on selected dimensions of the city’s spatio-temporal growth.
Methodology
This study employed an explanatory–evaluative design based on transportation and traffic data of Tehran for the period 1996–2021 (1375–1400 in the Iranian calendar). Data collection and analysis were carried out in four stages through the application of a quantitative analytical approach using shared indicators between transportation and urban growth, which have also been employed in previous studies [Aljoufie et al., 2013; Aljoufie et al., 2011; Guindon & Zhang, 2006].
Stage 1. The road length index was first extracted, which represents the ratio of the road length in each district to the district’s area. This index was calculated separately for all roads and for highways over the periods 2001–2006, 2006–2016, and 2016–2021. Subsequently, the growth rate of roads and highways relative to the previous period was computed using the Transport Infrastructure Expansion Index (TIEI_t) (Equation 1).
Equation (1)
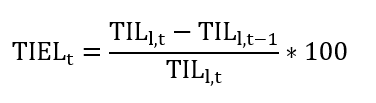
Where:
The analysis of factors influencing urban growth and expansion has been one of the key topics in urban geography in recent years [Aïkous et al., 2023; Aliakbari et al., 2021; Bosch et al., 2020; Dadashpoor & Ahani, 2019; Dahal et al., 2017; Galster et al., 2001]. Monitoring the process of urban growth for its proper management and control, particularly in metropolitan areas, necessitates examining the driving forces of urban growth and their components across different time periods [Dahal et al., 2017; Taubenbock et al., 2014; Bhatta, 2010]. This analytical framework is commonly referred to as spatio-temporal urban growth.
In the theoretical literature of urban geography, urban growth is a fundamental and comprehensive concept, defined as the transformation of land into built environments, and often used interchangeably with urbanization [Dahal et al., 2017]. Urban growth has also been described as the process of outward expansion of urban centers [Dadras et al., 2015]. Accordingly, spatio-temporal patterns of urban growth refer to the spatial characteristics of urban land within a specific geographical context over time [Dahal et al., 2017]. In general, analyzing spatio-temporal patterns of urban growth requires consideration of three essential dimensions: the location of growth, the magnitude of growth, and the timing of growth [Bosch et al., 2020; Bhatta, 2010].
To date, researchers in urban studies have investigated the roles of various natural, social, political, and economic factors in urban growth. However, transportation-related components have received relatively less attention, despite being among the most critical driving forces of urban growth [Aïkous et al., 2023; Perveen et al., 2018; Aljoufie et al., 2013; Bhatta, 2010]. Urban transportation generally refers to the movement of people and goods within and between cities [Rodrigue, 2020]. As a key component of urban communication systems, it facilitates mobility and accessibility between land uses and enables the flow of people and goods across urban spaces [Garrett, 2014].
The relationship between transportation and urban growth suggests that urbanization is fundamentally shaped by transport infrastructures such as roads, transit systems, and pedestrian networks. Urban transportation infrastructure, by attracting people and labor forces, provides a strong driver for urban expansion [Pokharel et al., 2021]. Since each city follows a unique temporal trajectory in the accumulation and development of transportation infrastructure, diverse urban forms, spatial structures, and corresponding transportation systems can be identified [Rodrigue, 2020]. Examples of these spatial structures include compact versus dispersed, monocentric versus polycentric, and linear versus radial forms, which emerge largely through the direct impact of transportation components on urban growth [Rodrigue, 2020; Hashemi, 2021; Muñiz & Garcia-López, 2019].
Among urban transportation infrastructures, highways play a particularly significant role in shaping urban growth. Since the 1950s, highways have functioned as catalysts of urban economic development, creating new opportunities and multiple competitive advantages for firms, individuals, and households [Canales et al., 2019; Credit, 2019; Higgins et al., 2014]. These advantages largely stem from two main factors: enhanced accessibility and reduced transportation costs, which are considered the major benefits of highways compared to other transport modes [Aïkous et al., 2023; Percoco, 2016; Bhatta, 2010; Baum-Snow, 2007]. Empirical evidence shows that highways have had at least three major impacts on urban growth: (1) encouraging suburbanization; (2) reducing population density in central cities; and (3) increasing population and economic activities in peripheral areas [Garcia-Lo´pez et al., 2015; Baum-Snow, 2007].
For instance, Percoco [2016] demonstrated that the location of highway exits in Italy over the 1951–2001 period significantly influenced employment, population growth, and industrial expansion, particularly in transport-related services. Highway infrastructure increases the likelihood of industrial and commercial development in surrounding areas, and such growth often persists even when governments attempt to restrict it through regulatory measures [Aïkous et al., 2023]. Levkovich et al. [2020] found that highways, by fostering population growth in peripheral areas, generated a leapfrog growth pattern, whereby suburban expansion bypasses development constraints and extends into more distant peripheries. Similarly, studies in the United States have shown that newly constructed beltways influenced urban development patterns by attracting office complexes, commercial establishments, and multi-family housing projects along their corridors [Nechyba & Walsh, 2004].
With respect to accessibility, studies by Bhatta and Drennan [2003] and Giuliano [2004] indicated that highway investments increase accessibility to various destinations, with the greatest benefits concentrated at or near the sites of investment. However, negative consequences of highways on certain aspects of urban development have also been reported. For example, Haider and Miller [2000] found that residential proximity to highways in Toronto led to reduced housing values due to noise and traffic-related disturbances. Similarly, Kim et al. [2007] revealed that in Seoul, every 1% increase in highway traffic noise was associated with a 3.1% decline in land values.
Overall, the review of existing studies highlights the reciprocal relationship between urban transportation infrastructure and land-use systems. Nonetheless, much of the literature has emphasized the role of land use in shaping transportation systems, while the reverse relationship, how transportation drives urban growth has received comparatively less attention. Against this backdrop, the present study investigates the role of urban highways, as one of the most critical transportation infrastructures, in shaping key dimensions of urban growth and expansion in Tehran between 1996 and 2021.
As Iran’s political and economic capital, the metropolis of Tehran currently faces severe urban transportation challenges manifested in traffic congestion, high population density, and environmental pollution [Bakhshi & Daryabari, 2020]. Due to its spatial structure, Tehran is essentially a car-dependent city [Ahar et al., 2022], and the impact of this auto-oriented pattern on uncontrolled urban sprawl is evident [Talkhabi et al., 2022]. Meanwhile, the city’s public transportation fleet has become increasingly obsolete due to insufficient investment and modernization, thereby aggravating its negative environmental consequences [Alizadeh et al., 2023]. In light of these challenges, and the urgent need for appropriate transportation policies to manage and control Tehran’s urban growth, the objective of this study is to analyze the influence of urban highways on selected dimensions of the city’s spatio-temporal growth.
Methodology
This study employed an explanatory–evaluative design based on transportation and traffic data of Tehran for the period 1996–2021 (1375–1400 in the Iranian calendar). Data collection and analysis were carried out in four stages through the application of a quantitative analytical approach using shared indicators between transportation and urban growth, which have also been employed in previous studies [Aljoufie et al., 2013; Aljoufie et al., 2011; Guindon & Zhang, 2006].
Stage 1. The road length index was first extracted, which represents the ratio of the road length in each district to the district’s area. This index was calculated separately for all roads and for highways over the periods 2001–2006, 2006–2016, and 2016–2021. Subsequently, the growth rate of roads and highways relative to the previous period was computed using the Transport Infrastructure Expansion Index (TIEI_t) (Equation 1).
Equation (1)
Where:
Here,
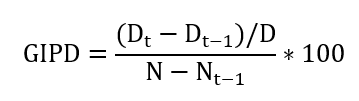
Stage 2. The average population density within a 700-meter buffer zone around highways was estimated for the years 1996, 2006, 2011, and 2016. The population density growth rate for each district relative to the preceding period was then calculated using the Population Diversity Growth Index (GIPD) (Equation 2).
Equation (2)
Where:
- Dt = population density in the current period
- Dt-1 = population density in the previous period
- N & Nt-1 = temporal intervals between the two periods
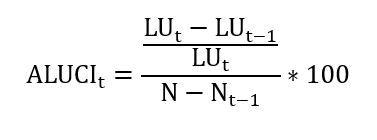
Stage 3. The land use area within a 700-meter buffer of highways was estimated for each district in 2006 and 2016 (1385 and 1395). The land use growth rate relative to the preceding period was computed using the Annual Land Use Change Index (ALUCI) (Equation 3).
Equation (3)
Where:
Equation (3)
Where:
- LUt= land use area in the current period
- LUt−1 = land use area in the previous period
Stage 4. Land price data for Tehran’s 22 districts were extracted, and their spatial distribution was mapped. Using Geographically Weighted Regression (GWR), the spatial correlation between land prices and two parameters, road length and annual traffic volume in each district, was assessed (Equation 4).
Equation (4)
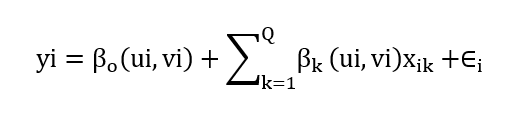
Where:
Equation (4)
Where:
- (ui,vi)=coordinates of the i-th location in space
- yi = dependent parameter at location i
- xik = value of the k-th independent parameter at location i
- βk(ui,vi)= local regression coefficients for parameter k at location i
- β0(ui,vi)= intercept at location i
In Tehran, the hierarchy of road networks consists of freeways, highways, arterial roads, and local access roads, with highways accounting for a substantial portion of the network (Figure 1). Highway construction began in the early 1970s (1350s) and, particularly after the adoption of Tehran’s first Master Plan in 1968 (1347), became a priority of urban management. Most of Tehran’s highways run in an east–west direction, shaped by the city’s spatial structure and topographical constraints.
Findings
Assessment of Transportation Infrastructure Growth in Tehran Metropolis
The data analysis process began with a focus on the growth and expansion of Tehran’s urban transportation infrastructure. For this purpose, the “Transportation Infrastructure Growth Index” was employed, based on two parameters: “total street length” and “highway length” for the periods 2001–2006 and 2006–2016. Initial results indicated that the expansion of inner-city streets in Tehran during the five-year period from 2001 to 2006 was greater than the ten-year period from 2006-2016. This change was particularly evident in districts 13 to 22 (except district 21), demonstrating that the southern and peripheral areas of Tehran experienced high growth rates in street length during this five-year period. After 2006, when transportation infrastructure development stabilized across all districts of Tehran, these changes reached a relative equilibrium (Figure 1-a). Similar results were observed for the highway length parameter. However, the difference in changes between the two periods for highway length was greater than that for total streets, indicating that Tehran’s urban transport policies prioritized highway development. Additionally, for highways, significant regional disparities were observed between districts over the two periods. Districts 11, 13, 7, and 9 showed the highest growth in the first period and the lowest in the second (Figure 1-b). Overall, highway infrastructure expansion peaked during 2006–2011 and then sharply declined in the inner and central districts from 2016–2021, while increasing in peripheral areas (Figure 2-c).
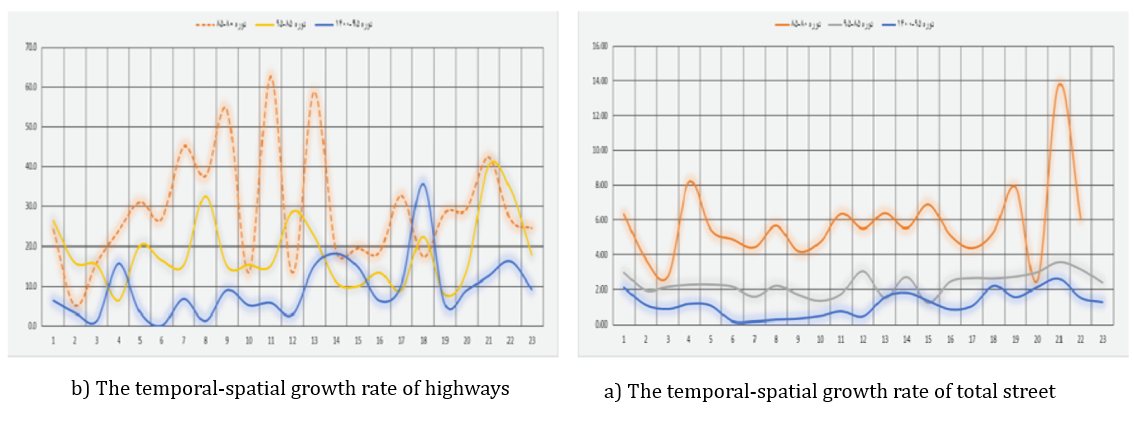
Figure 1. Temporal-spatial growth of transportation infrastructure in Tehran
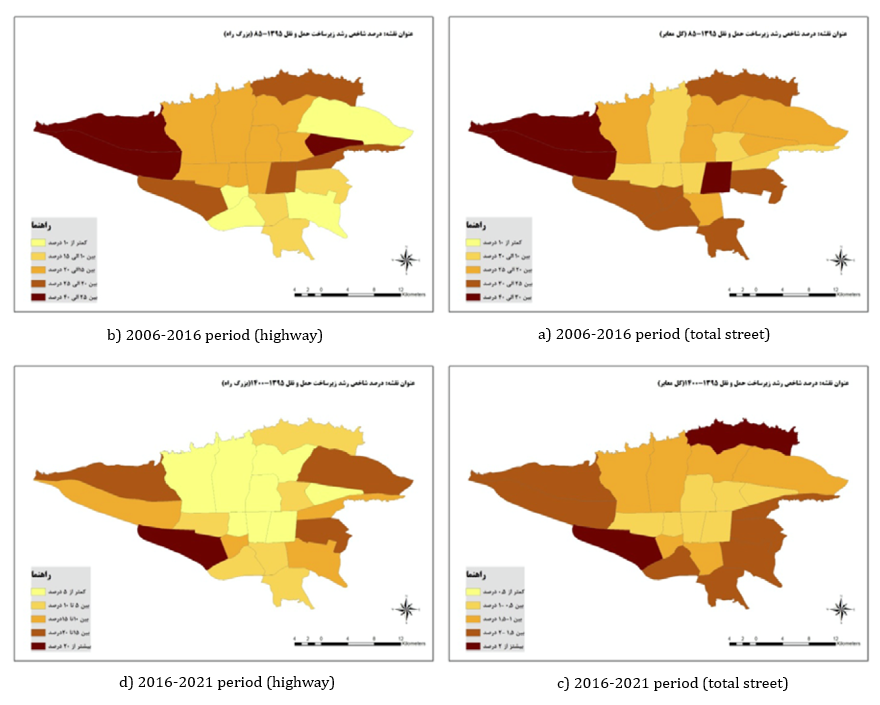
Figure 2. Growth percentage of Tehran’s transportation infrastructure index, 2006-2021
Impact of Urban Transportation on Population Density Growth Around Highways
One of the most significant effects of transportation on urban growth is the increase in population density near transportation nodes and infrastructure. To illustrate this impact, the “Period Population Density Growth Index” was used. Accordingly, the average population density within a 700-meter radius of highways was calculated for the periods 1996–2006, 2006–2011, 2011–2016. The results showed that average population density around highways increased in absolute terms in each period compared to the previous one, with the increase after 2006 being particularly noticeable due to the expansion of Tehran’s highways. In subsequent periods, the population density pattern remained largely similar to that of 2006 (Figure 3-a).
According to the population density growth rate chart (Figure 3-b), during 1996-2006, districts 8, 21, 4, 13, 22, and 7 experienced the highest population density increases within the 700-meter highway buffer, while the average for other districts exceeded 4 and district 12 had the lowest growth rate. In 2006–2011, districts 8, 7, 9, followed by 18, 21, and 22, had high growth rates, with district 8 experiencing the largest increase. The overall pattern was similar to the previous period, although growth rates declined. By 2011–2016, all districts reached relative equilibrium in population density growth, indicating the filling of vacant areas around highways and the corresponding population absorption in Tehran’s periphery and suburban settlements.
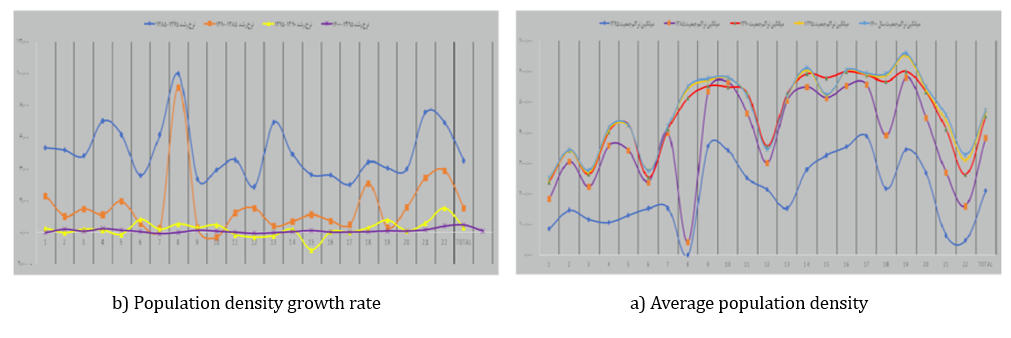
Figure 3. Average and growth rate of population density within 700 meters of highways
Regarding the impact of specific highways on population density, Basij, Imam Ali, Navab, and Yadegar Imam Highways experienced the highest population growth in their vicinity. Additionally, in the northwest of Tehran, Hemmat, Hakim, Niayesh, and Sheikh Fazlollah Highways saw significant density increases over the past three periods. Overall, southern Tehran highways contributed more to population growth than northern ones. Figures 4-b and 4-c show the clear effect of constructing highways such as Imam Ali Highway in districts 4, 7, 8, 13, 14, 15, and 20. The population density and growth rates from 2011 onward, when the highway became operational, are highly significant. For example, district 8, previously one of the least dense districts in 1996 and 2006, experienced a sharp increase in density after 2011 following the highway construction, which continued in subsequent periods. Notably, highway development in Tehran’s peripheral districts, including 19, 20, 21, and especially 22, increased population absorption around highways. Districts 19 and 22, once among the least dense areas, experienced continuous density growth due to multiple highway constructions and complementary measures such as residential complexes, tourism projects, and green space development.
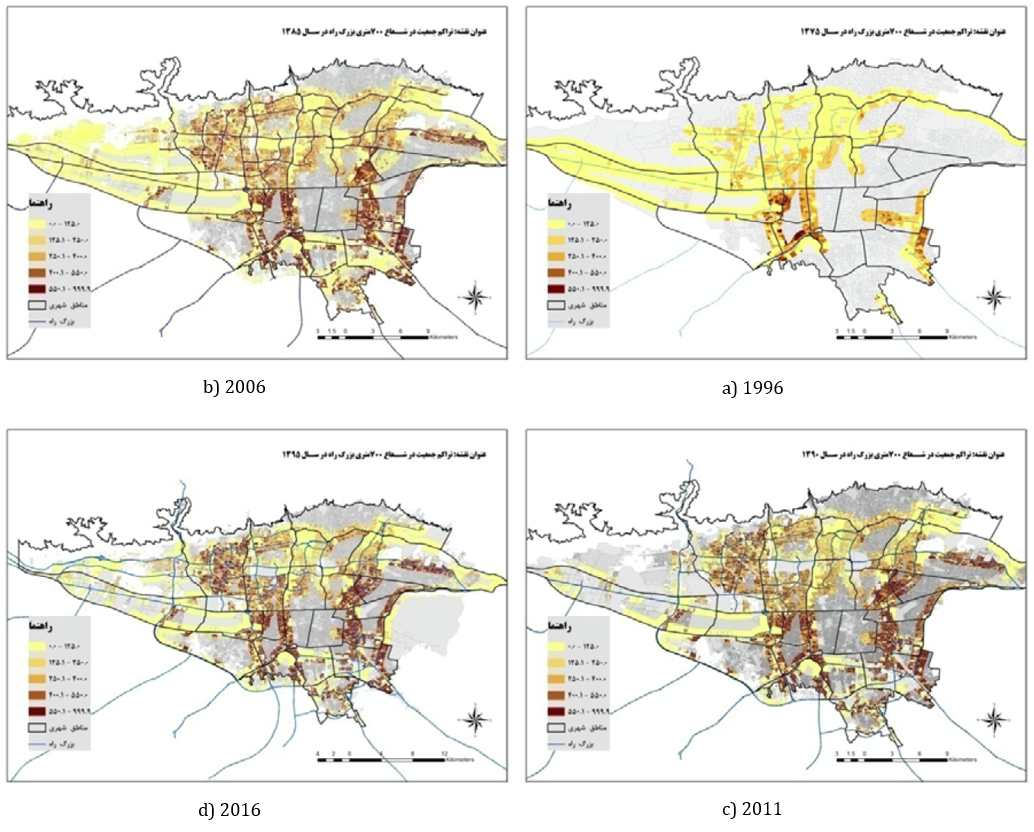
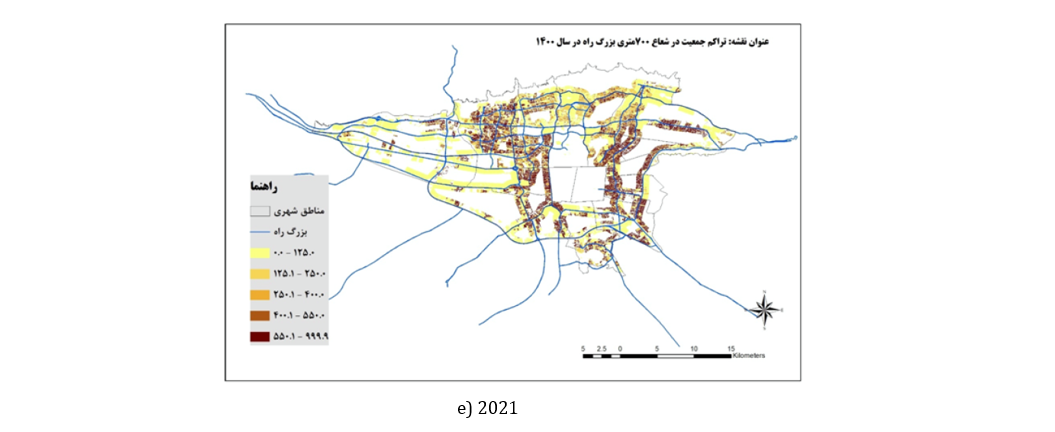
Figure 4. Population density within 700 meters of highways, 1996–2021
Land-Use Changes Due to Highway Construction
Residential land use: Residential land use in districts 3, 4, 10, 11, 12, and 13 had negative growth rates . These districts coincide with Tehran’s Central Business District (CBD), and the decline is due to residential areas giving way to commercial and administrative uses. The lowest residential growth occurred in districts 3 and 4, while the highest occurred in districts 19 and 22.
Green space: This land use showed significant regional differences between northern and southern Tehran. Highest growth occurred in district 13, followed by district 19. In contrast, districts 21, 3, 5, 6, and 2 had negative growth, with district 21’s decline being industrially driven. In general, southern districts experienced higher growth in green space.
Urban services: Considerable regional variation was observed in urban services, with districts 9, 11, 3, 16, 14, and 5 having the highest growth, whereas districts 17, 19, 15, and 10 had negative growth (Figure 5).
Industrial land use: Districts 6, 21, and 18 had the largest industrial growth. In some districts, residential growth coincided with industrial decline, shifting the district’s function from industrial to residential, as seen in district 19 following multiple highway projects.
Commercial-administrative land use: Among six land-use types, commercial-administrative use had the highest growth, particularly in southern districts like 16, 11, and 18 (Figure 6).
Vacant land: Vacant land showed negative growth across all districts.
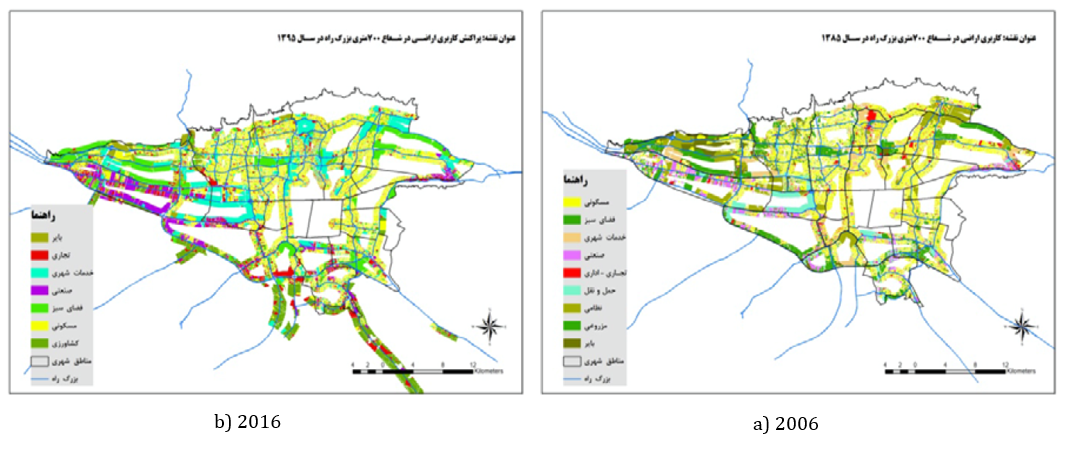
Figure 5. Land-use distribution within 700 meters of highways, 2006–2016
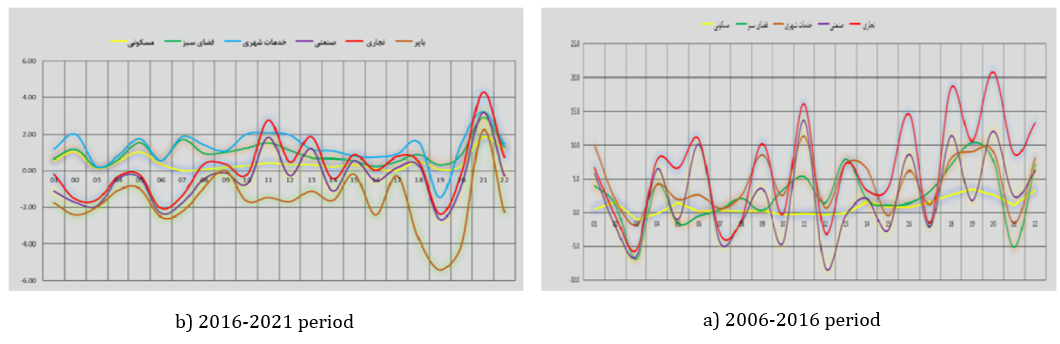
Figure 6. Land-use growth rates within 700 meters of highways in Tehran’s 22 districts
Impacts of Urban Transportation on Land and Property Values
Urban transportation affects land and property values as proximity to transport networks, highways, and certain infrastructures (e.g., metro, bus systems) influences prices. This impact is consequential, as it reflects both positive and negative outcomes of accessibility. In this section, land prices were analyzed regionally, and spatial correlations between land price, street length, and traffic volume were estimated. Base data were derived from the price per square meter of built-up land in 2021 across Tehran’s 22 districts. Results indicated that districts 1–7 and 22 had higher land prices than other districts, with districts 1 and 3 showing significant differences (Figure 7-a). The spatial pattern of land prices exhibited a north-south bipolarity, aligning with climatic, slope, and topographic characteristics (Figure 7-b), resulting in affluent populations concentrating in the cooler northern districts.
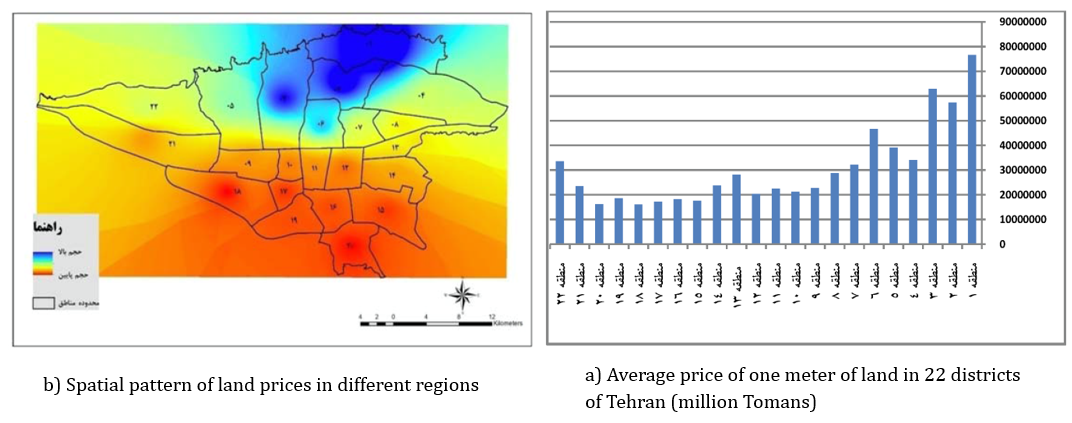
Figure 7. Land price characteristics in Tehran, 2021
Spatial correlation results between land prices and traffic volume indicated that in northern districts, higher traffic volume coincided with higher land prices, although this correlation was not statistically significant in most districts (Figure 8-a). Correlations between land price and street length showed two patterns: in the first, positive correlations existed in districts 4, 2, and several others, due to multiple highways passing through these areas; in the second, negative correlations appeared in northeastern districts (except district 4) due to shorter streets or the absence of highways and beltways. In southern districts, negative correlations occurred despite relatively long streets, attributable to low traffic volumes (Figure 8-b).
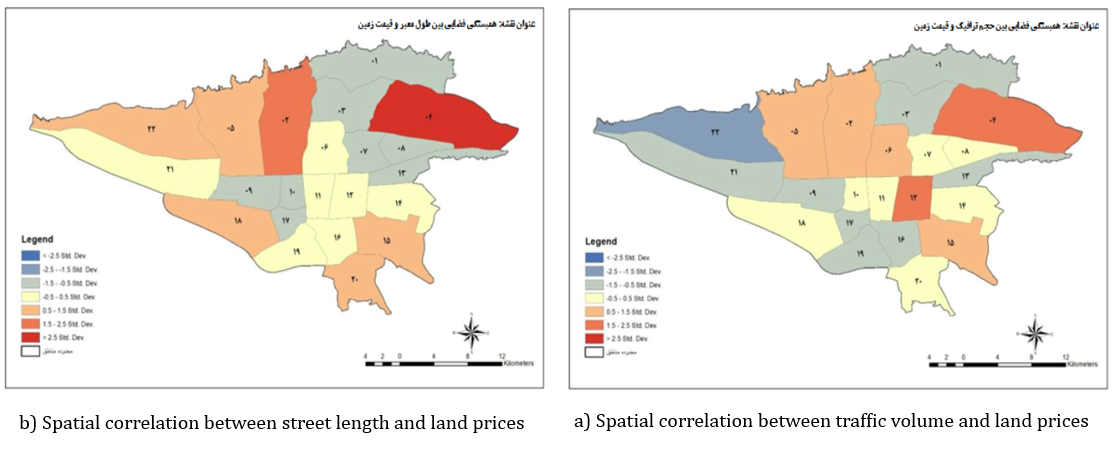
Figure 8. Spatial correlation of land prices with urban transportation parameters in Tehran
Discussion
This study aimed to examine the impact of highways, as a key component of urban transportation infrastructure, on urban growth indicators. To this end, the research data were analyzed across four major axes. The first axis of discussion focused on the growth of urban transportation infrastructure over the study period. Results showed that the growth rate of highway infrastructure exceeded that of the overall road network. Over the past fifty years, more highways have consistently been constructed in Tehran, with a particularly rapid expansion observed between 2001 and 2011, followed by a relative stabilization by 2021. Moreover, transportation infrastructure growth was higher in peripheral areas compared to inner-city zones, indicating that due to saturation and congestion within central areas, urban expansion predominantly occurred toward the outskirts and boundaries of Tehran’s metropolitan area, primarily facilitated through highway development. This finding aligns with Bhatta’s [2010] theory of outward growth and is consistent with the studies by Aljoufie [2013] and Pokharel et al. [2021].
The second axis of discussion concerned changes in population density around highways, revealing two key outcomes:
Moderated population density growth: Population density around Tehran’s highways increased rapidly during 1996–2006 and then reached a relative equilibrium. During this same period, transportation infrastructure growth initially surged, then progressed more slowly in subsequent years. This indicates that population density growth was synchronized with the expansion of transportation infrastructure, with both eventually stabilizing over time. These findings are consistent with Aljoufie [Aljoufie, 2013].
Center–periphery pattern of population growth: The highest population density growth occurred near north–south highways, following a center–periphery pattern around Tehran. This suggests the presence of vacant lands and rapid construction in these areas alongside highway development. Correspondingly, Jahandar Lashaki [2019] found that with the construction of Imam Ali Highway, rural areas near the highway quickly began receiving population, with many vacant lands converted to residential buildings within 15 years. Li et al. [2022] also confirmed that proximity to transportation infrastructure induces greater population density growth in peripheral and suburban areas than in inner-city zones.
The third axis addressed land-use changes adjacent to highways. As researchers such as Tillema et al. [2010] and Aljoufie [2013] argued, transportation systems and land-use systems interact dynamically, with both evolving over time. In Tehran, the interplay between these systems revealed four key outcomes:
Growth of Tehran’s CBD: Highway construction in Tehran directed residential land uses toward peripheral areas, while commercial and administrative uses concentrated in the CBD. According to existing studies, the primary indicator of CBD growth in a city is the increasing share of commercial and administrative uses relative to residential uses [Liu et al., 2016; Burger & Meijers, 2012; Bertaud, 2003]. Changes in land use in Districts 19 and 21 from industrial to residential, alongside increased green space in southern areas and reduced green space in central districts, reflect greater centralization in Tehran’s CBD. Additionally, the highest growth among all land-use types occurred in commercial areas of the city center. Thus, highway expansion in Tehran has simultaneously fostered small secondary commercial centers in peripheral areas and strengthened centralization in the city’s main commercial hub. These findings are consistent with Ahar et al. [2022], Hashemi [2021], and Dadashpoor & Ahani [2019].
Extensive functional changes in peripheral and fringe areas: Another consequence of highway expansion was widespread land-use change in peri-urban zones, altering the function of urban and rural settlements. Specifically, conversion of barren, industrial, and agricultural lands to residential and commercial uses in villages surrounding Tehran, along with industrial expansion from these areas further outward, created a broad functional zone supporting the city’s needs, highlighting highways’ role in accelerating this process. These results align with Ebadi et al. [2015]. Furthermore, Jahandar Lashaki [2019] showed that after constructing Imam Ali Highway, southern peripheral areas were transformed into public green spaces and specialized green uses, while agricultural land was gradually converted into urban uses.
Increased land-use diversity and mixing: The spatiotemporal patterns of land-use changes in Tehran indicated that both the number and distribution of land-use types increased. Thus, highways contributed to creating spatial diversity and aggregation of land uses. Analysis of barren land area and growth rate showed that a substantial portion of this land was converted to other uses after 2006, consistent with the spatial patterns of highways, resulting in greater land-use diversity. Other studies have confirmed these findings [Aïkous et al., 2023; Garcia-López et al., 2015; Aljoufie, 2011].
Formation of an integrated metropolitan region: Collectively, these processes resulted in a broad, interconnected urban network within the Tehran metropolitan area. According to Pokharel et al. [2021], urban transportation infrastructure links cities or intra-urban regions, forming larger urban networks, which in turn promotes industrial and residential development along transportation routes. Although Tehran’s integrated urban network is not yet fully realized, several studies suggest that the metropolitan area is moving in this direction [Ahar et al., 2022; Talkhabi et al., 2022; Hashemi, 2021; Dadashpoor & Ahani, 2019; Jahandar Lashaki, 2019; Ebadi et al., 2015]. Shorter spatiotemporal distances between inner-city areas correspond to higher regional integration and improved economic development [Huang & Xu, 2021].
The final analytical axis examined spatial patterns of land prices and their correlation with traffic volume and road length. Land and housing prices serve as comprehensive indicators of the quality and quantity of urban development [Kheyroddin & Omidi Bahremand, 2017]. Two important points emerged:
Findings
Assessment of Transportation Infrastructure Growth in Tehran Metropolis
The data analysis process began with a focus on the growth and expansion of Tehran’s urban transportation infrastructure. For this purpose, the “Transportation Infrastructure Growth Index” was employed, based on two parameters: “total street length” and “highway length” for the periods 2001–2006 and 2006–2016. Initial results indicated that the expansion of inner-city streets in Tehran during the five-year period from 2001 to 2006 was greater than the ten-year period from 2006-2016. This change was particularly evident in districts 13 to 22 (except district 21), demonstrating that the southern and peripheral areas of Tehran experienced high growth rates in street length during this five-year period. After 2006, when transportation infrastructure development stabilized across all districts of Tehran, these changes reached a relative equilibrium (Figure 1-a). Similar results were observed for the highway length parameter. However, the difference in changes between the two periods for highway length was greater than that for total streets, indicating that Tehran’s urban transport policies prioritized highway development. Additionally, for highways, significant regional disparities were observed between districts over the two periods. Districts 11, 13, 7, and 9 showed the highest growth in the first period and the lowest in the second (Figure 1-b). Overall, highway infrastructure expansion peaked during 2006–2011 and then sharply declined in the inner and central districts from 2016–2021, while increasing in peripheral areas (Figure 2-c).
Figure 1. Temporal-spatial growth of transportation infrastructure in Tehran
Figure 2. Growth percentage of Tehran’s transportation infrastructure index, 2006-2021
Impact of Urban Transportation on Population Density Growth Around Highways
One of the most significant effects of transportation on urban growth is the increase in population density near transportation nodes and infrastructure. To illustrate this impact, the “Period Population Density Growth Index” was used. Accordingly, the average population density within a 700-meter radius of highways was calculated for the periods 1996–2006, 2006–2011, 2011–2016. The results showed that average population density around highways increased in absolute terms in each period compared to the previous one, with the increase after 2006 being particularly noticeable due to the expansion of Tehran’s highways. In subsequent periods, the population density pattern remained largely similar to that of 2006 (Figure 3-a).
According to the population density growth rate chart (Figure 3-b), during 1996-2006, districts 8, 21, 4, 13, 22, and 7 experienced the highest population density increases within the 700-meter highway buffer, while the average for other districts exceeded 4 and district 12 had the lowest growth rate. In 2006–2011, districts 8, 7, 9, followed by 18, 21, and 22, had high growth rates, with district 8 experiencing the largest increase. The overall pattern was similar to the previous period, although growth rates declined. By 2011–2016, all districts reached relative equilibrium in population density growth, indicating the filling of vacant areas around highways and the corresponding population absorption in Tehran’s periphery and suburban settlements.
Figure 3. Average and growth rate of population density within 700 meters of highways
Regarding the impact of specific highways on population density, Basij, Imam Ali, Navab, and Yadegar Imam Highways experienced the highest population growth in their vicinity. Additionally, in the northwest of Tehran, Hemmat, Hakim, Niayesh, and Sheikh Fazlollah Highways saw significant density increases over the past three periods. Overall, southern Tehran highways contributed more to population growth than northern ones. Figures 4-b and 4-c show the clear effect of constructing highways such as Imam Ali Highway in districts 4, 7, 8, 13, 14, 15, and 20. The population density and growth rates from 2011 onward, when the highway became operational, are highly significant. For example, district 8, previously one of the least dense districts in 1996 and 2006, experienced a sharp increase in density after 2011 following the highway construction, which continued in subsequent periods. Notably, highway development in Tehran’s peripheral districts, including 19, 20, 21, and especially 22, increased population absorption around highways. Districts 19 and 22, once among the least dense areas, experienced continuous density growth due to multiple highway constructions and complementary measures such as residential complexes, tourism projects, and green space development.
Figure 4. Population density within 700 meters of highways, 1996–2021
Land-Use Changes Due to Highway Construction
Residential land use: Residential land use in districts 3, 4, 10, 11, 12, and 13 had negative growth rates . These districts coincide with Tehran’s Central Business District (CBD), and the decline is due to residential areas giving way to commercial and administrative uses. The lowest residential growth occurred in districts 3 and 4, while the highest occurred in districts 19 and 22.
Green space: This land use showed significant regional differences between northern and southern Tehran. Highest growth occurred in district 13, followed by district 19. In contrast, districts 21, 3, 5, 6, and 2 had negative growth, with district 21’s decline being industrially driven. In general, southern districts experienced higher growth in green space.
Urban services: Considerable regional variation was observed in urban services, with districts 9, 11, 3, 16, 14, and 5 having the highest growth, whereas districts 17, 19, 15, and 10 had negative growth (Figure 5).
Industrial land use: Districts 6, 21, and 18 had the largest industrial growth. In some districts, residential growth coincided with industrial decline, shifting the district’s function from industrial to residential, as seen in district 19 following multiple highway projects.
Commercial-administrative land use: Among six land-use types, commercial-administrative use had the highest growth, particularly in southern districts like 16, 11, and 18 (Figure 6).
Vacant land: Vacant land showed negative growth across all districts.
Figure 5. Land-use distribution within 700 meters of highways, 2006–2016
Figure 6. Land-use growth rates within 700 meters of highways in Tehran’s 22 districts
Impacts of Urban Transportation on Land and Property Values
Urban transportation affects land and property values as proximity to transport networks, highways, and certain infrastructures (e.g., metro, bus systems) influences prices. This impact is consequential, as it reflects both positive and negative outcomes of accessibility. In this section, land prices were analyzed regionally, and spatial correlations between land price, street length, and traffic volume were estimated. Base data were derived from the price per square meter of built-up land in 2021 across Tehran’s 22 districts. Results indicated that districts 1–7 and 22 had higher land prices than other districts, with districts 1 and 3 showing significant differences (Figure 7-a). The spatial pattern of land prices exhibited a north-south bipolarity, aligning with climatic, slope, and topographic characteristics (Figure 7-b), resulting in affluent populations concentrating in the cooler northern districts.
Figure 7. Land price characteristics in Tehran, 2021
Spatial correlation results between land prices and traffic volume indicated that in northern districts, higher traffic volume coincided with higher land prices, although this correlation was not statistically significant in most districts (Figure 8-a). Correlations between land price and street length showed two patterns: in the first, positive correlations existed in districts 4, 2, and several others, due to multiple highways passing through these areas; in the second, negative correlations appeared in northeastern districts (except district 4) due to shorter streets or the absence of highways and beltways. In southern districts, negative correlations occurred despite relatively long streets, attributable to low traffic volumes (Figure 8-b).
Figure 8. Spatial correlation of land prices with urban transportation parameters in Tehran
Discussion
This study aimed to examine the impact of highways, as a key component of urban transportation infrastructure, on urban growth indicators. To this end, the research data were analyzed across four major axes. The first axis of discussion focused on the growth of urban transportation infrastructure over the study period. Results showed that the growth rate of highway infrastructure exceeded that of the overall road network. Over the past fifty years, more highways have consistently been constructed in Tehran, with a particularly rapid expansion observed between 2001 and 2011, followed by a relative stabilization by 2021. Moreover, transportation infrastructure growth was higher in peripheral areas compared to inner-city zones, indicating that due to saturation and congestion within central areas, urban expansion predominantly occurred toward the outskirts and boundaries of Tehran’s metropolitan area, primarily facilitated through highway development. This finding aligns with Bhatta’s [2010] theory of outward growth and is consistent with the studies by Aljoufie [2013] and Pokharel et al. [2021].
The second axis of discussion concerned changes in population density around highways, revealing two key outcomes:
Moderated population density growth: Population density around Tehran’s highways increased rapidly during 1996–2006 and then reached a relative equilibrium. During this same period, transportation infrastructure growth initially surged, then progressed more slowly in subsequent years. This indicates that population density growth was synchronized with the expansion of transportation infrastructure, with both eventually stabilizing over time. These findings are consistent with Aljoufie [Aljoufie, 2013].
Center–periphery pattern of population growth: The highest population density growth occurred near north–south highways, following a center–periphery pattern around Tehran. This suggests the presence of vacant lands and rapid construction in these areas alongside highway development. Correspondingly, Jahandar Lashaki [2019] found that with the construction of Imam Ali Highway, rural areas near the highway quickly began receiving population, with many vacant lands converted to residential buildings within 15 years. Li et al. [2022] also confirmed that proximity to transportation infrastructure induces greater population density growth in peripheral and suburban areas than in inner-city zones.
The third axis addressed land-use changes adjacent to highways. As researchers such as Tillema et al. [2010] and Aljoufie [2013] argued, transportation systems and land-use systems interact dynamically, with both evolving over time. In Tehran, the interplay between these systems revealed four key outcomes:
Growth of Tehran’s CBD: Highway construction in Tehran directed residential land uses toward peripheral areas, while commercial and administrative uses concentrated in the CBD. According to existing studies, the primary indicator of CBD growth in a city is the increasing share of commercial and administrative uses relative to residential uses [Liu et al., 2016; Burger & Meijers, 2012; Bertaud, 2003]. Changes in land use in Districts 19 and 21 from industrial to residential, alongside increased green space in southern areas and reduced green space in central districts, reflect greater centralization in Tehran’s CBD. Additionally, the highest growth among all land-use types occurred in commercial areas of the city center. Thus, highway expansion in Tehran has simultaneously fostered small secondary commercial centers in peripheral areas and strengthened centralization in the city’s main commercial hub. These findings are consistent with Ahar et al. [2022], Hashemi [2021], and Dadashpoor & Ahani [2019].
Extensive functional changes in peripheral and fringe areas: Another consequence of highway expansion was widespread land-use change in peri-urban zones, altering the function of urban and rural settlements. Specifically, conversion of barren, industrial, and agricultural lands to residential and commercial uses in villages surrounding Tehran, along with industrial expansion from these areas further outward, created a broad functional zone supporting the city’s needs, highlighting highways’ role in accelerating this process. These results align with Ebadi et al. [2015]. Furthermore, Jahandar Lashaki [2019] showed that after constructing Imam Ali Highway, southern peripheral areas were transformed into public green spaces and specialized green uses, while agricultural land was gradually converted into urban uses.
Increased land-use diversity and mixing: The spatiotemporal patterns of land-use changes in Tehran indicated that both the number and distribution of land-use types increased. Thus, highways contributed to creating spatial diversity and aggregation of land uses. Analysis of barren land area and growth rate showed that a substantial portion of this land was converted to other uses after 2006, consistent with the spatial patterns of highways, resulting in greater land-use diversity. Other studies have confirmed these findings [Aïkous et al., 2023; Garcia-López et al., 2015; Aljoufie, 2011].
Formation of an integrated metropolitan region: Collectively, these processes resulted in a broad, interconnected urban network within the Tehran metropolitan area. According to Pokharel et al. [2021], urban transportation infrastructure links cities or intra-urban regions, forming larger urban networks, which in turn promotes industrial and residential development along transportation routes. Although Tehran’s integrated urban network is not yet fully realized, several studies suggest that the metropolitan area is moving in this direction [Ahar et al., 2022; Talkhabi et al., 2022; Hashemi, 2021; Dadashpoor & Ahani, 2019; Jahandar Lashaki, 2019; Ebadi et al., 2015]. Shorter spatiotemporal distances between inner-city areas correspond to higher regional integration and improved economic development [Huang & Xu, 2021].
The final analytical axis examined spatial patterns of land prices and their correlation with traffic volume and road length. Land and housing prices serve as comprehensive indicators of the quality and quantity of urban development [Kheyroddin & Omidi Bahremand, 2017]. Two important points emerged:
- North–south pattern of land prices: First, the spatial distribution of land prices in Tehran exhibited a north–south bipolar pattern. In this regard, highways showed little direct correlation with land prices, as real estate values are influenced by factors such as land speculation, construction rates, economic recessions or inflation, topography, climate, and locational desirability. Consequently, northern Tehran, particularly District 1, exhibited the highest land and housing prices despite irregular and non-standard road networks causing accessibility challenges. This finding aligns with Moshfeghi et al. [2020].
- Indirect effects of highways on land prices: Second, highways generally influence land and housing prices, but primarily indirectly. Bhatta & Drennan [2003] and Giuliano [2004] showed that residential proximity to highways increases property values due to accessibility advantages. However, Kheyroddin & Omidi Bahremand [2017] found that the impact of Sadr Expressway on land prices was direct: property values within 60 meters of the highway grew slowly due to noise, whereas those 60–120 meters away increased significantly because of accessibility benefits and overall locational desirability.
This study faced limitations, including lack of satellite imagery for historical urban growth and insufficient longitudinal data for periods prior to 2006. Future research could address these constraints if feasible.
The following recommendations may support urban growth management based on transportation indicators:
The following recommendations may support urban growth management based on transportation indicators:
- Revising and updating Tehran’s comprehensive transport and traffic plan with a smart urban growth approach.
- Defining growth-control regulations based on urban transportation indicators within the strategic structural revision of Tehran’s comprehensive plan.
- Developing new regulations to limit construction in villages near highways to prevent uncontrolled growth.
- Implementing an intelligent monitoring system for urban growth aligned with global megacity experiences, with periodic six-month and annual assessments.
- Utilizing intelligent transportation system technologies to control travel demand, schedule public transit, coordinate traffic signals, and reduce air pollution.
- Expanding institutional and managerial collaboration among all urban transportation organizations, road and urban development authorities, and municipalities to integrate actions and decisions related to urban growth.
Conclusion
The impacts of highways on various urban growth components differ in terms of temporal and spatial patterns, as well as the type of growth indicators affected. In the short term, highways exert a stronger influence on population density changes than on land-use changes. However, in the long term, this relationship reverses: population density stabilizes, while land-use changes lead to extensive functional transformations in the roles and operations of settlements. Consequently, highways play a fundamental role in expanding Tehran’s urban extent and metropolitan boundaries toward peripheral areas distant from the city center.
Acknowledgments: No specific acknowledgments were reported by the authors.
Ethical Approval: No ethical approval issues were reported by the authors.
Conflict of Interest: This article is derived from the first author’s doctoral dissertation under the supervision of the second and third authors, with consultation from the fourth author at the Faculty of Geography and the Department of Human Geography, Kharazmi University, Tehran, and was conducted with the authors’ personal funding.
Author Contributions: Ahar H (first author), Main researcher/Discussion writer (50%); Zanganeh A (second author), Introduction writer (20%); Khaksari Rafsanjani A (third author), Methodologist(20%); Karami T (fourth author), Statistical Analyst (10%).
Funding: This research was conducted with the authors’ personal funding.
Keywords:
References
1. Ahar H, Zanganeh A, Khaksari A, Karami T (2022). An analysis of the interactions between the patterns of space syntax and urban cores in Tehran metropolis. Journal of Sustainable City. 5(2):1-19. [Persian] [Link]
2. Aïkous M, Dubé J, Brunelle C, Champagne M (2023). Highway expansion and impacts on land use changes: An event study approach. Transportation Research Part D: Transport and Environment. 119:103730. [Link] [DOI:10.1016/j.trd.2023.103730]
3. Aliakbari I, Amirian S, Hosseini M (2021). Role of government in the peri-urban development; a case study of Sanandaj, Iran. Geographical Researches. 36(4):347-362. [Persian] [Link]
4. Alizadeh T, Azimi Amoli J, Motevalli S, Sarvar R (2023). Eco-friendly public transportation scenarios of Tehran metropolitan in 2031 horizon. Geographical Researches. 38(2):121-132. [Persian] [Link]
5. Aljoufie M, Zuidgeest M, Brussel M, van Maarseveen M (2011). Urban growth and transport: Understanding the spatial temporal relationship. WIT Transactions on the Built Environment. 116:315-328. [Link] [DOI:10.2495/UT110271]
6. Aljoufie M, Zuidgeest M, Brussel M, van Maarseveen M (2013). Spatial-temporal analysis of urban growth and transportation in Jeddah City, Saudi Arabia. Cities. 31:57-68. [Link] [DOI:10.1016/j.cities.2012.04.008]
7. Bakhshi R, Daryabari J (2020). Investigating the intelligentization of urban transportation systems in line with the sustainable development of cities (case study: Tehran metropolis). Journal of Urban Economics and Management. 8(32):31-46. [Persian] [Link]
8. Baum-Snow N (2007). Did highways cause suburbanization?. Quarterly Journal of Economics. 122(2):775-805. [Link] [DOI:10.1162/qjec.122.2.775]
9. Baum-Snow N (2007). Suburbanization and transportation in the monocentric model. Journal of Urban Economics. 62(3):405-423. [Link] [DOI:10.1016/j.jue.2006.11.006]
10. Bertaud A (2003). Tehran spatial structure: Constraints and opportunities for future development. Tehran: Ministry of Housing and Urban Development. [Link]
11. Bhatta SD, Drennan MP (2003). The economic benefits of public investment in transportation: A review of recent literature. Journal of Planning Education and Research. 22(3):288-296. [Link] [DOI:10.1177/0739456X02250317]
12. Bhatta B (2010). Analysis of urban growth and sprawl from remote sensing data. Advances in geographic information science. Heidelberg: Springer. [Link] [DOI:10.1007/978-3-642-05299-6]
13. Bosch M, Jaligot R, Chenal J (2020). Spatiotemporal patterns of urbanization in three Swiss urban agglomerations: Insights from landscape metrics, growth modes and fractal analysis. Landscape Ecology. 35(4):879-891. [Link] [DOI:10.1007/s10980-020-00985-y]
14. Burger M, Meijers E (2012). Form follows function? Linking morphological and functional polycentricity. Urban Studies. 49(5):1127-1149. [Link] [DOI:10.1177/0042098011407095]
15. Canales K, Nilsson I, Demelle E (2019). Do Light rail transit investments increase employment opportunities? The case of Charlotte, North Carolina. Regional Science Policy & Practice. 11(1):189-202. [Link] [DOI:10.1111/rsp3.12184]
16. Credit K (2019). Accessibility and agglomeration: A theoretical framework for understanding the connection between transportation modes, agglomeration benefits, and types of businesses. Geography Compass. 13(4):1-14. [Link] [DOI:10.1111/gec3.12425]
17. Dadashpoor H, Ahani S (2019). A conceptual typology of the spatial territories of the peripheral areas of metropolises. Habitat International. 90:102015. [Link] [DOI:10.1016/j.habitatint.2019.102015]
18. Dadras M, Shafri ZM, Ahmad N, Pradhan B, Safarpour S (2015). Spatio-temporal analysis of urban growth from remote sensing data in Bandar Abbas city, Iran. The Egyptian Journal of Remote Sensing and Space Sciences. 18(1):35-52. [Link] [DOI:10.1016/j.ejrs.2015.03.005]
19. Dahal KR, Benner S, Lindquist E (2017). Urban hypotheses and spatiotemporal characterization of urban growth in the Treasure Valley of Idaho, USA. Applied Geography. 79:11-25. [Link] [DOI:10.1016/j.apgeog.2016.12.002]
20. Ebadi B, Ghoreishi A, Molaei Hashjin N (2015). Spatial analysis of functional changes of villages of southwest of Tehran metropolis. Journal of New Attitude in Human Geography. 7(3):105-121. [Persian] [Link]
21. Garcia-Lo'pez MA, Sole'-Olle' A, Viladecans-Marsal E (2015). Do land use policies follow road construction?. IEB Working Paper. SSRN Electronic Journal. [Link] [DOI:10.2139/ssrn.2411432]
22. Garrett M, editor (2014). Encyclopedia of transportation: Social Science and Policy. London: SAGE Publications. [Link] [DOI:10.4135/9781483346526]
23. Giuliano G (2004). Land use impacts of transportation investments: Highway and transit. In: Hanson S, Giuliano G, editors. The geography of urban transportation. New York: Guilford Publications. 237-273. [Link]
24. Galster G, Hanson R, Ratcliffe MR, Wolman H, Coleman S, Freihage J (2001). Wrestling sprawl to the ground: Defining and measuring an elusive concept. Housing Policy Debate. 12(4):681-717. [Link] [DOI:10.1080/10511482.2001.9521426]
25. Guindon B, Zhang Y (2006). Using satellite remote sensing to survey transportation-related urban sustainability: Part I: Methodologies for indicator quantification. International Journal of Applied Earth Observation and Geoinformation. 8(3):149-164. [Link] [DOI:10.1016/j.jag.2005.08.005]
26. Haider M, Miller E (2000). Effects of transportation infrastructure and location on residential real estate values: Application of spatial autoregressive technique. Transportation Research Record. 1722(1):1-8. [Link] [DOI:10.3141/1722-01]
27. Hashemi B (2021). Analysis of the role of different functional nuclei on the spatial structure of Karaj metropolis. Geographical Researches. 36(4):447-458. [Persian] [Link]
28. Higgins C, Ferguson M, Kanaroglou P (2014). Light rail and land use change: Rail transit's role in reshaping and revitalizing cities. Journal of Public Transportation. 17(2):93-112. [Link] [DOI:10.5038/2375-0901.17.2.5]
29. Huang Y, Xu W (2021). Spatial and temporal heterogeneity of the impact of high-speed railway on urban economy: Empirical study of Chinese cities. Journal of Transport Geography. 91:102972. [Link] [DOI:10.1016/j.jtrangeo.2021.102972]
30. Jahandar Lashaki Gh (2019). Analysis of the effects of intra-city highways on surrounding spaces (research case: Imam Ali highway). Doctoral Thesis on Geography and Urban Planning. Tehran: Kharazmi University. [Persian] [Link]
31. Kheyroddin R, Omidi Bahremand M (2017). The impact of urban mega-project on housing price in adjacent neighborhoods (case study: Sadr multi-layered highway, Tehran). Journal of Urban Economics and Management. 5(17):13-29. [Persian] [Link]
32. Kim K, Park SJ, Kweon Y (2007). Highway traffic noise effects on land price in an urban area. Transportation Research Part D: Transport and Environment. 12(4):275-280. [Link] [DOI:10.1016/j.trd.2007.03.002]
33. Levkovich O, Rouwendal J, Ommeren J (2020). The impact of highways on population redistribution: The role of land development restrictions. Journal of Economic Geography. 20(3):783-808. [Link] [DOI:10.1093/jeg/lbz003]
34. Li X, Zhang M, Wang J (2022). The spatio-temporal relationship between land use and population distribution around new intercity railway stations: A case study on the Pearl River Delta region, China. Journal of Transport Geography. 98:103274. [Link] [DOI:10.1016/j.jtrangeo.2021.103274]
35. Liu X, Derudde B, Wu K (2016). Measuring polycentric urban development in China: An intercity transportation network perspective. Regional Studies. 50(8):1302-1315. [Link] [DOI:10.1080/00343404.2015.1004535]
36. Moshfeghi V, Haghighat Naeini Gh, Habibi M (2020). Analyzing the relationship between land use changes and land prices in Tehran with emphasis on 'commission of article five' approvals. Journal of Geography and Environmental Planning. 30(4):1-18. [Persian] [Link]
37. Muñiz I, Garcia-López MÀ (2019). Urban form and spatial structure as determinants of the ecological footprint of commuting. Transportation Research Part D: Transport and Environment. 67:334-350. [Link] [DOI:10.1016/j.trd.2018.08.006]
38. Nechyba TJ, Walsh RP (2004). Urban sprawl. Journal of Economic Perspectives. 18(4):177-200. [Link] [DOI:10.1257/0895330042632681]
39. Percoco M (2016). Highways, local economic structure and urban development. Journal of Economic Geography. 16(5):1035-1054. [Link] [DOI:10.1093/jeg/lbv031]
40. Perveen S, Kamruzzaman MD, Yigitcanlar T (2018). What to assess to model the transport impacts of urban growth? A Delphi approach to examine the space-time suitability of transport indicators. International Journal of Sustainable Transportation. 13(8):597-613. [Link] [DOI:10.1080/15568318.2018.1491077]
41. Pokharel R, Bertolini L, Brömmelstroet M, Raj Acharya S (2021). Spatio-temporal evolution of cities and regional economic development in Nepal: Does transport infrastructure matter?. Journal of Transport Geography. 90:102904 [Link] [DOI:10.1016/j.jtrangeo.2020.102904]
42. Rodrigue JP (2020). The geography of transportation system. 5th edition. London: Routledge. [Link] [DOI:10.4324/9780429346323]
43. Talkhabi H, Jafarpour Ghalehteimouri K, Soleimani Mehranjani M, Zanganeh A, Karami T (2022). Spatial and temporal population change in the Tehran Metropolitan Region and its consequences on urban decline and sprawl. Ecological Informatics. 70:101731. [Link] [DOI:10.1016/j.ecoinf.2022.101731]
44. Taubenbock H, Wiesner M, Felbier A, Marconcini M, Esch T, Dech S (2014). New dimensions of urban landscapes: The spatio-temporal evolution from a polynuclei area to a mega-region based on remote sensing data. Applied Geography. 47:137-153. [Link] [DOI:10.1016/j.apgeog.2013.12.002]
45. Tillema T, van Wee B, Ettema D (2010). The influence of (toll-related) travel costs in residential location decisions of households: A stated choice approach. Transportation Research Part A: Policy and Practice. 44(10):785-796. [Link] [DOI:10.1016/j.tra.2010.07.009]