
Bilingual
En/Fa
Geographical Research is Published in both Persian and English Full-text.
Volume 39, Issue 3 (2024)
GeoRes 2024, 39(3): 369-377 |
Back to browse issues page
Article Type:
Subject:


History
Received: 2024/09/8 | Accepted: 2024/10/8 | Published: 2024/10/20
Received: 2024/09/8 | Accepted: 2024/10/8 | Published: 2024/10/20
How to cite this article
Shayegan M, Ranjbar M, Reza B, Arbabi A. Climate Comfort Conditions for Tourism in Hamadan Province. GeoRes 2024; 39 (3) :369-377
URL: http://georesearch.ir/article-1-1645-en.html
URL: http://georesearch.ir/article-1-1645-en.html
Download citation:
BibTeX | RIS | EndNote | Medlars | ProCite | Reference Manager | RefWorks
Send citation to:


Rights and permissions
BibTeX | RIS | EndNote | Medlars | ProCite | Reference Manager | RefWorks
Send citation to:

1- Department of Geography, Science and Research Branch, Islamic Azad University, Tehran, Iran
2- Department of Geography, Yadegar-e-eImam Khomeini (RAH), Shahre Rey Branch, Islamic Azad University, Tehran, Iran
3- Department of Geography, Faculty of Humanities, Ahvaz Branch, Islamic Azad University, Ahvaz, Iran
2- Department of Geography, Yadegar-e-eImam Khomeini (RAH), Shahre Rey Branch, Islamic Azad University, Tehran, Iran
3- Department of Geography, Faculty of Humanities, Ahvaz Branch, Islamic Azad University, Ahvaz, Iran
Full-Text (HTML) (557 Views)
Background
Climate change is considered a serious threat to the tourism industry, as weather and climate are among the key factors contributing to its success. These changes can affect tourist flow patterns, the length of tourism seasons, and the geographical location of destinations. As a result, concepts such as vulnerability, resilience, and adaptation strategies have become essential in tourism planning.
Previous Studies
Previous studies have extensively examined the impacts of climate change on the tourism industry. The IPCC (2014) report highlights changes in tourism destinations and seasons. Hall et al. (2015) have criticized pessimistic views on the impacts of climate change by presenting empirical evidence, emphasizing the importance of focusing on adaptation and flexibility. Scott et al. (2012) and Smit & Wandel (2006) have also explored the concept of adaptation in tourism. Studies such as Watson et al. (2013) have highlighted the weaknesses of existing vulnerability models and stressed the need to consider non-climatic factors such as social capital (Adger, 2000; 2009). Additionally, research by Roscher et al. (2013) and Bloor & Bardgett (2012) has demonstrated the role of resource richness in enhancing the resilience of tourism destinations to climate change.
Aim(s)
This study investigated and evaluated the climatic comfort conditions for tourism in Hamadan Province based on the Neural Stress Index, the Thom’s Discomfort Index (THI), and the Climate Performance Index (CPI).
Research Type
The present study was applied in nature.
Research Society, Place and Time
The research population included meteorological stations in Hamadan Province, covering the cities of Hamadan, Tuyserkan, Asadabad, Razan, Famenin, Nahavand, Qahavand, Nojeh, and Malayer. The study was conducted in Hamadan Province, which is recognized as one of the major tourist destinations in western Iran. This research was carried out in 2023, and the data used pertained to the period from 2004 to 2018.
Sampling Method and Number
The sampling method in this study was non-random and purposive, based on climatic data from selected meteorological stations in Hamadan Province. In total, data from 9 meteorological stations including Hamadan, Tuyserkan, Asadabad, Razan, Famenin, Nahavand, Qahavand, Nojeh, and Malayer were used for a 15-year period (2004 to 2018). These stations were selected based on their geographical coverage of the province and the availability of reliable climatic data.
Used Devices & Materials
In this study, climatic data recorded at meteorological stations, including temperature, relative humidity, wind speed, and air pressure were used. The main analytical tools consisted of statistical and climatic software for calculating and analyzing thermal comfort indices such as the Neural Stress Index, THI (Temperature-Humidity Index), and CPI (Climate Potential Index). The data sources were obtained from the database of the Iranian Meteorological Organization.
Findings by Text
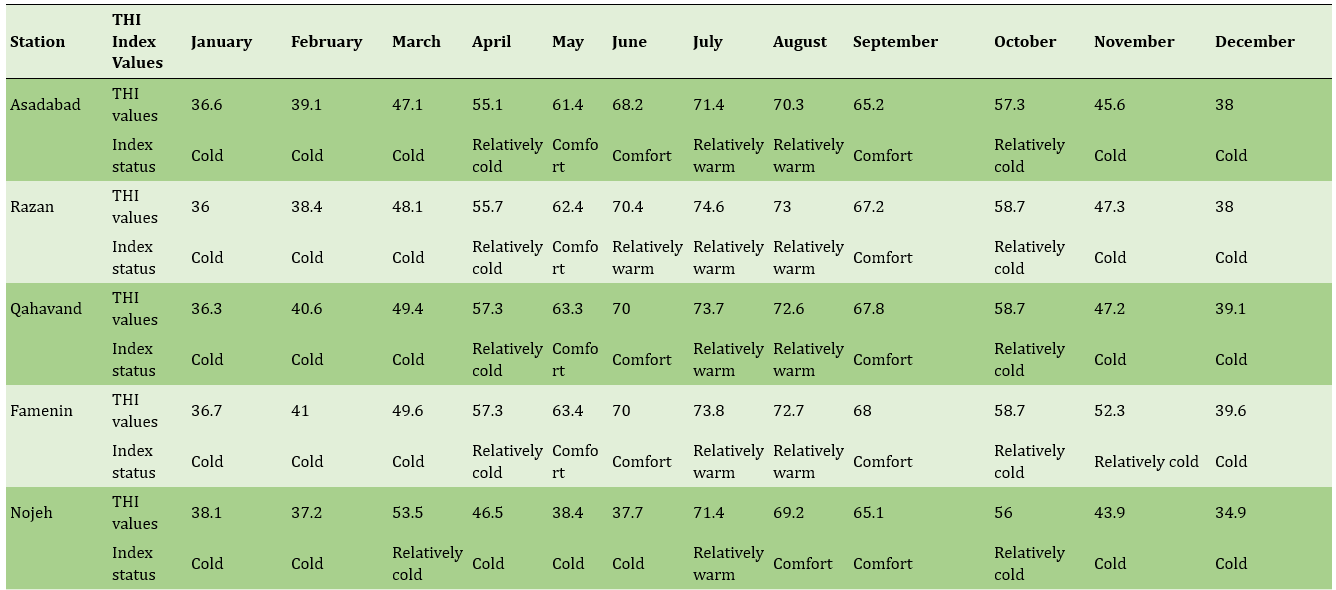
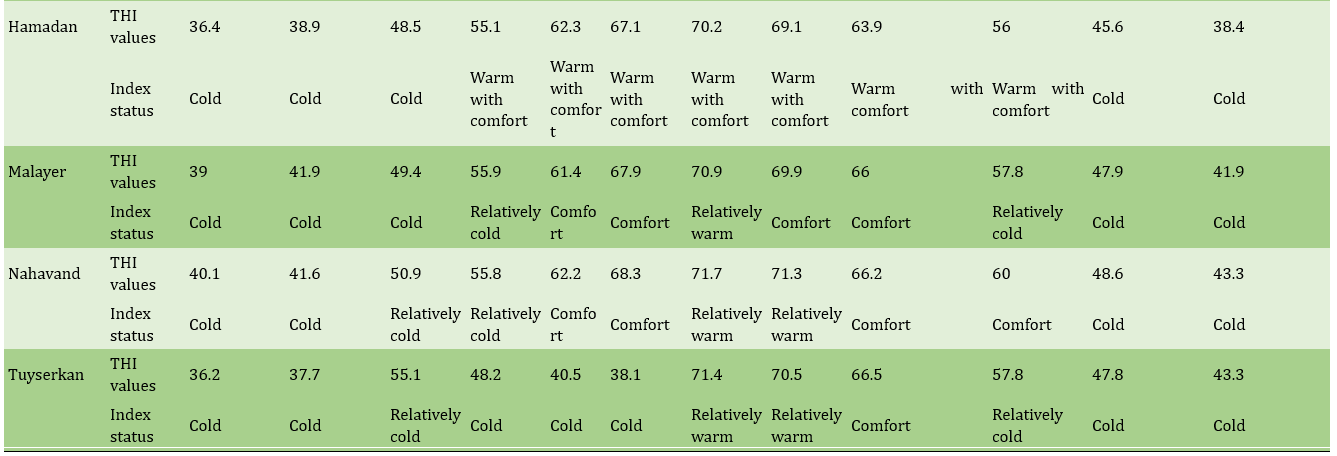
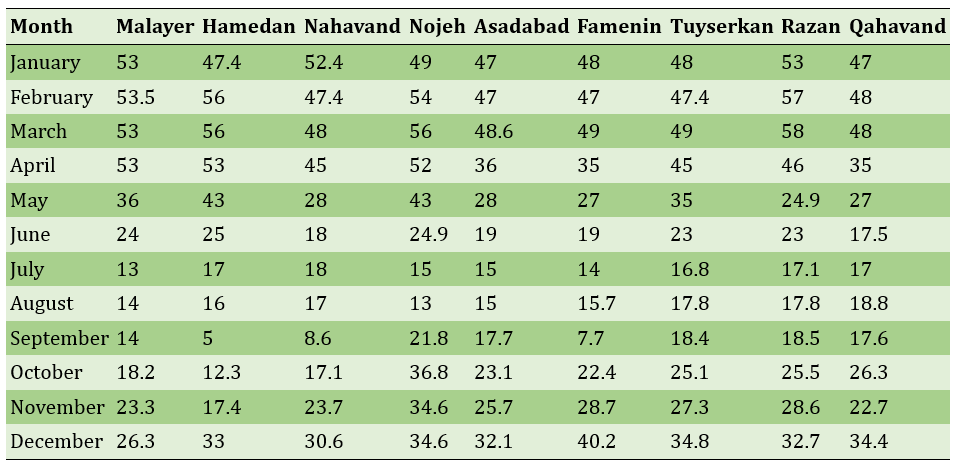
The analysis of thermal comfort conditions in the study area of Hamadan Province was conducted using various indices. The THI index showed that during the winter season, especially in January and February, all stations experienced cold and uniform conditions, with index values ranging from 36 to 41.9, indicating severe cold and unfavorable climatic conditions. In March, some areas became slightly warmer, reaching a “relatively cold” status. In the spring season, April still reflected cold and unfavorable conditions across the region, but by May, conditions shifted toward thermal comfort, with the THI index indicating a climate suitable for attracting tourists. Summer began relatively warm in July, followed by improved conditions in September. Autumn began with cold weather in October, creating relatively cold and uniform conditions across the region. Overall, the best period for tourism was identified as from late winter to mid-summer (Table 1).
Table 1. Thermal comfort coefficients based on the Steadman THI Index (2004–2018)
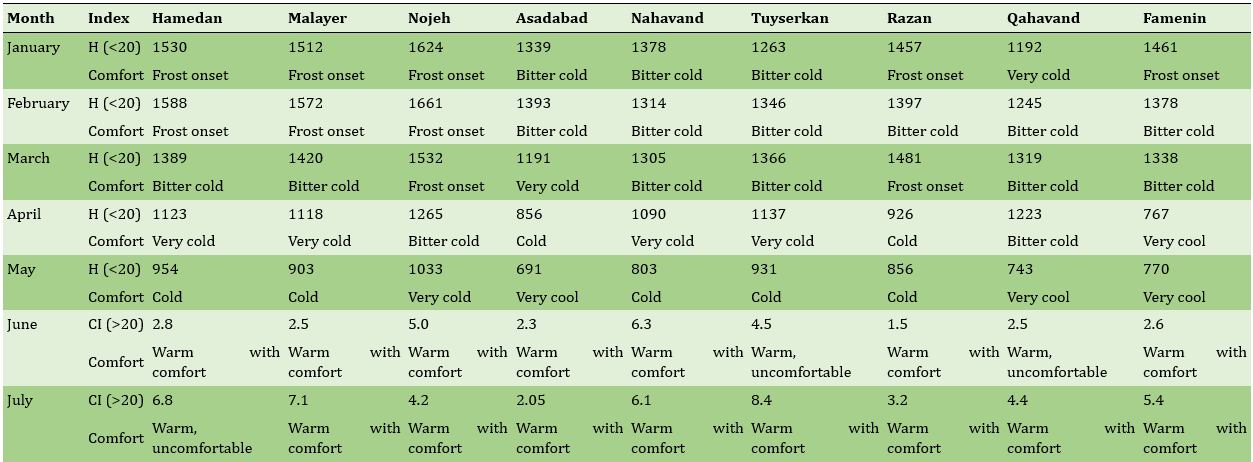
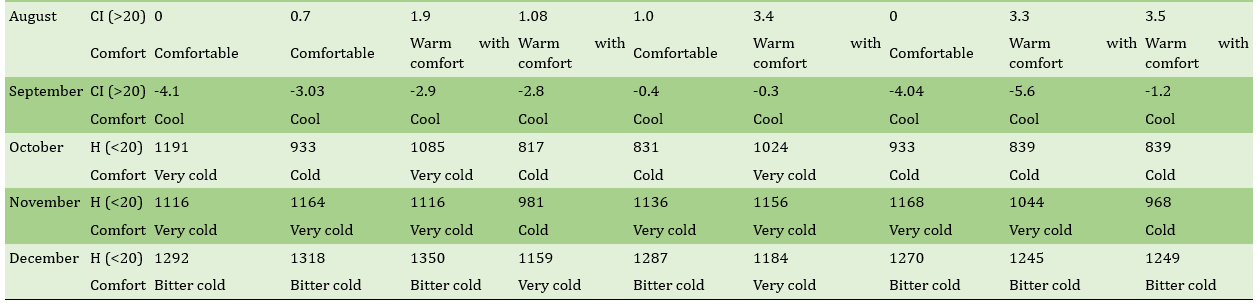
Based on the Neural Stress Index, the winter season showed varying conditions across the stations. In January, some stations experienced conditions described as “beginning of skin freezing,” while others faced severe cold. A similar pattern persisted in February, although with slight moderation. By March, temperatures began to rise, indicating a shift toward milder cold. During spring, the weather became more favorable and diverse, with all stations ranging from “very cold” to “cool,” which can help attract more tourists. Summer w:as char:acterized by relatively uniform and warm conditions; in some stations, it reached the level of “discomfort,” although it was generally tolerable. In autumn, the trend shifted toward colder weather, and all stations fell into either the “cold” or “very cold” categories (Table 2).
Table 2. Thermal comfort coefficients based on Stress Index formula at the studied stations
The CPI index showed a similar pattern; during winter and early spring, the northern and southern areas of the province experienced cold and unfavorable conditions. In April, some regions moved out of the very cold category and shifted toward more favorable conditions. In May and June, the climate improved, becoming cool and ideal. Summer demonstrated very comfortable thermal conditions throughout the region, and even in September, two classes of “mild and pleasant” and “cool” were observed, indicating a favorable human bioclimate and attractiveness for tourists. Autumn was marked by increased climatic fluctuations, and in October, three different classes of “cool,” “cold and somewhat stressful,” and “very cold” were seen in various parts of the province, reflecting the region’s diverse climatic conditions (Table 3).
Table 3. Results of CPI Index calculation at stations in Hamadan Province during the study period
Main Comparisons to Similar Studies
The present study, by examining the climatic comfort conditions for tourism in Hamadan Province, aligns with previous research in emphasizing the use of various indices such as CPI, the Neural Stress Index (CI), and THI. The CPI index, applied in studies by Banafsheh & Abdolalizadeh (2018) and Kazemirad & Abedi (2024), indicates that the most suitable times for tourism in Hamadan Province are primarily during the summer and autumn months, which is consistent with the similar findings of this study. Additionally, the findings related to the Neural Stress Index in this research are comparable to those of Faridi & Azimi (2018), who have demonstrated varying physiological stress during cold and warm periods of the year. Furthermore, the results from the THI analysis in this study are in agreement with the work of Khaledi et al. (2020), which has identified time intervals of comfort and semi-comfort in the bioclimatic environment. Overall, these comparisons underscore the validity of the indices used and the consistency of the results with prior studies in the field of climate and tourism development.
Suggestions
Based on the results of the climate study in Hamadan, it is recommended to focus on developing tourism infrastructure and services primarily during the spring and summer seasons when climatic conditions are most favorable. Additionally, providing adequate heating facilities and comfortable indoor spaces can help attract tourists during the cold winter months. Continuous monitoring of climate changes is essential for effective tourism management, and offering accurate information about seasonal climate conditions to visitors will enhance their experience. Finally, planning tourism activities according to regional climatic data can optimize visitor satisfaction and support sustainable tourism development.
Conclusion
In the two winter months of Dey and Bahman, climatic conditions across almost all stations in the province are generally unsuitable for tourism, and March (Esfand) also does not offer favorable conditions. The best months for travel and tourism in Hamadan Province are early Shahrivar (with ideal conditions at all stations), followed by Ordibehesht and Khordad. Additionally, July, August, and October are other suitable months for tourism.
Acknowledgments: None reported by the authors.
Ethical Permission: No issues reported by the authors.
Conflict of Interest: This article is derived from the first author's thesis. There is no conflict of interest.
Authors’ Contributions: Shayegan M (First author), Introduction Writer/Discussion Writer/ Methodologist/Statistical Analyst (40%); Ranjbar M (Second author), Introduction Writer/Discussion Writer (20%); Borna R (Third author), Statistical Analyst (20%); Arbabi A (Fourth Author), Introduction Writer/Discussion Writer (20%)
Funding: None reported by the authors.
Climate change is considered a serious threat to the tourism industry, as weather and climate are among the key factors contributing to its success. These changes can affect tourist flow patterns, the length of tourism seasons, and the geographical location of destinations. As a result, concepts such as vulnerability, resilience, and adaptation strategies have become essential in tourism planning.
Previous Studies
Previous studies have extensively examined the impacts of climate change on the tourism industry. The IPCC (2014) report highlights changes in tourism destinations and seasons. Hall et al. (2015) have criticized pessimistic views on the impacts of climate change by presenting empirical evidence, emphasizing the importance of focusing on adaptation and flexibility. Scott et al. (2012) and Smit & Wandel (2006) have also explored the concept of adaptation in tourism. Studies such as Watson et al. (2013) have highlighted the weaknesses of existing vulnerability models and stressed the need to consider non-climatic factors such as social capital (Adger, 2000; 2009). Additionally, research by Roscher et al. (2013) and Bloor & Bardgett (2012) has demonstrated the role of resource richness in enhancing the resilience of tourism destinations to climate change.
Aim(s)
This study investigated and evaluated the climatic comfort conditions for tourism in Hamadan Province based on the Neural Stress Index, the Thom’s Discomfort Index (THI), and the Climate Performance Index (CPI).
Research Type
The present study was applied in nature.
Research Society, Place and Time
The research population included meteorological stations in Hamadan Province, covering the cities of Hamadan, Tuyserkan, Asadabad, Razan, Famenin, Nahavand, Qahavand, Nojeh, and Malayer. The study was conducted in Hamadan Province, which is recognized as one of the major tourist destinations in western Iran. This research was carried out in 2023, and the data used pertained to the period from 2004 to 2018.
Sampling Method and Number
The sampling method in this study was non-random and purposive, based on climatic data from selected meteorological stations in Hamadan Province. In total, data from 9 meteorological stations including Hamadan, Tuyserkan, Asadabad, Razan, Famenin, Nahavand, Qahavand, Nojeh, and Malayer were used for a 15-year period (2004 to 2018). These stations were selected based on their geographical coverage of the province and the availability of reliable climatic data.
Used Devices & Materials
In this study, climatic data recorded at meteorological stations, including temperature, relative humidity, wind speed, and air pressure were used. The main analytical tools consisted of statistical and climatic software for calculating and analyzing thermal comfort indices such as the Neural Stress Index, THI (Temperature-Humidity Index), and CPI (Climate Potential Index). The data sources were obtained from the database of the Iranian Meteorological Organization.
Findings by Text
The analysis of thermal comfort conditions in the study area of Hamadan Province was conducted using various indices. The THI index showed that during the winter season, especially in January and February, all stations experienced cold and uniform conditions, with index values ranging from 36 to 41.9, indicating severe cold and unfavorable climatic conditions. In March, some areas became slightly warmer, reaching a “relatively cold” status. In the spring season, April still reflected cold and unfavorable conditions across the region, but by May, conditions shifted toward thermal comfort, with the THI index indicating a climate suitable for attracting tourists. Summer began relatively warm in July, followed by improved conditions in September. Autumn began with cold weather in October, creating relatively cold and uniform conditions across the region. Overall, the best period for tourism was identified as from late winter to mid-summer (Table 1).
Table 1. Thermal comfort coefficients based on the Steadman THI Index (2004–2018)
Based on the Neural Stress Index, the winter season showed varying conditions across the stations. In January, some stations experienced conditions described as “beginning of skin freezing,” while others faced severe cold. A similar pattern persisted in February, although with slight moderation. By March, temperatures began to rise, indicating a shift toward milder cold. During spring, the weather became more favorable and diverse, with all stations ranging from “very cold” to “cool,” which can help attract more tourists. Summer w:as char:acterized by relatively uniform and warm conditions; in some stations, it reached the level of “discomfort,” although it was generally tolerable. In autumn, the trend shifted toward colder weather, and all stations fell into either the “cold” or “very cold” categories (Table 2).
Table 2. Thermal comfort coefficients based on Stress Index formula at the studied stations
The CPI index showed a similar pattern; during winter and early spring, the northern and southern areas of the province experienced cold and unfavorable conditions. In April, some regions moved out of the very cold category and shifted toward more favorable conditions. In May and June, the climate improved, becoming cool and ideal. Summer demonstrated very comfortable thermal conditions throughout the region, and even in September, two classes of “mild and pleasant” and “cool” were observed, indicating a favorable human bioclimate and attractiveness for tourists. Autumn was marked by increased climatic fluctuations, and in October, three different classes of “cool,” “cold and somewhat stressful,” and “very cold” were seen in various parts of the province, reflecting the region’s diverse climatic conditions (Table 3).
Table 3. Results of CPI Index calculation at stations in Hamadan Province during the study period
Main Comparisons to Similar Studies
The present study, by examining the climatic comfort conditions for tourism in Hamadan Province, aligns with previous research in emphasizing the use of various indices such as CPI, the Neural Stress Index (CI), and THI. The CPI index, applied in studies by Banafsheh & Abdolalizadeh (2018) and Kazemirad & Abedi (2024), indicates that the most suitable times for tourism in Hamadan Province are primarily during the summer and autumn months, which is consistent with the similar findings of this study. Additionally, the findings related to the Neural Stress Index in this research are comparable to those of Faridi & Azimi (2018), who have demonstrated varying physiological stress during cold and warm periods of the year. Furthermore, the results from the THI analysis in this study are in agreement with the work of Khaledi et al. (2020), which has identified time intervals of comfort and semi-comfort in the bioclimatic environment. Overall, these comparisons underscore the validity of the indices used and the consistency of the results with prior studies in the field of climate and tourism development.
Suggestions
Based on the results of the climate study in Hamadan, it is recommended to focus on developing tourism infrastructure and services primarily during the spring and summer seasons when climatic conditions are most favorable. Additionally, providing adequate heating facilities and comfortable indoor spaces can help attract tourists during the cold winter months. Continuous monitoring of climate changes is essential for effective tourism management, and offering accurate information about seasonal climate conditions to visitors will enhance their experience. Finally, planning tourism activities according to regional climatic data can optimize visitor satisfaction and support sustainable tourism development.
Conclusion
In the two winter months of Dey and Bahman, climatic conditions across almost all stations in the province are generally unsuitable for tourism, and March (Esfand) also does not offer favorable conditions. The best months for travel and tourism in Hamadan Province are early Shahrivar (with ideal conditions at all stations), followed by Ordibehesht and Khordad. Additionally, July, August, and October are other suitable months for tourism.
Acknowledgments: None reported by the authors.
Ethical Permission: No issues reported by the authors.
Conflict of Interest: This article is derived from the first author's thesis. There is no conflict of interest.
Authors’ Contributions: Shayegan M (First author), Introduction Writer/Discussion Writer/ Methodologist/Statistical Analyst (40%); Ranjbar M (Second author), Introduction Writer/Discussion Writer (20%); Borna R (Third author), Statistical Analyst (20%); Arbabi A (Fourth Author), Introduction Writer/Discussion Writer (20%)
Funding: None reported by the authors.
References
1. Adger WN (2000). Social and ecological resilience: Are they related?. Progress in Human Geography. 24(3):347-364. [Link] [DOI:10.1191/030913200701540465]
2. Adger WN (2009). Social capital, collective action, and adaptation to climate change. Economic Geography. 79(4):387-404. [Link] [DOI:10.1111/j.1944-8287.2003.tb00220.x]
3. Banafsheh MR, Abdolalizadeh F (2018). Study of tourism climate in East Azarbaijan province using CPI index. Proceeding of the 2nd National Iranian Climate Conference. Mashhad: Ferdowsi University of Mashhad. [Persian] [Link]
4. Bloor JMG, Bardgett RD (2012). Stability of above-ground and below-ground processes to extreme drought in model grassland ecosystems: Interactions with plant species diversity and soil nitrogen availability. Perspectives in Plant Ecology, Evolution and Systematics. 14(3):193-204. [Link] [DOI:10.1016/j.ppees.2011.12.001]
5. Bujosa A, Riera A, Torres CM (2015). Valuing tourism demand attributes to guide climate change adaptation measures efficiently: The case of the Spanish domestic travel market. Tourism Management. 47:233-239. [Link] [DOI:10.1016/j.tourman.2014.09.023]
6. Dilling L, Daly ME, Travis WR, Wilhelmi OV, Klein RA (2015). The dynamics of vulnerability: Why adapting to climate variability will not always prepare us for climate change. WIREs Climate Change. 6(4):413-425. [Link] [DOI:10.1002/wcc.341]
7. Dogru T, Marchio EA, Bulut U, Suess C (2019). Climate change: Vulnerability and resilience of tourism and the entire economy. Tourism Management. 72:292-305. [Link] [DOI:10.1016/j.tourman.2018.12.010]
8. Faridi E, Azimi F (2018). Compare the thermal comfort of tourists in the city of Abadan and Zanjan. Quarterly of Geography & Regional Planning. 8(30):167-177. [Link]
9. Füssel HM, Hildén M (2014). How is uncertainty addressed in the knowledge base for national adaptation planning?. In: Adapting to an uncertain climate. Cham: Springer. p. 41-66. [Link] [DOI:10.1007/978-3-319-04876-5_3]
10. Gössling S, Scott D, Michael Hall C, Ceron JP, Dubois G (2012). Consumer behaviour and demand response of tourists to climate change. Annals of Tourism Research. 39(1):36-58. [Link] [DOI:10.1016/j.annals.2011.11.002]
11. Hall CM, Amelung B, Cohen S, Eijgelaar E, Gössling S, Higham J, et al (2015). Denying bogus skepticism in climate change and tourism research. Tourism Management. 47:352-356. [Link] [DOI:10.1016/j.tourman.2014.08.009]
12. Hamilton JM, Maddison DJ, Tol RS (2005). Climate change and international tourism: A simulation study. Global Environmental Change. 15(3):253-266. [Link] [DOI:10.1016/j.gloenvcha.2004.12.009]
13. Hyman TA (2014). Assessing the vulnerability of beach tourism and non-beach tourism to climate change: A case study from Jamaica. Journal of Sustainable Tourism. 22(8):1197-1215. [Link] [DOI:10.1080/09669582.2013.855220]
14. Ionescu C, Richard J, Klein T, Hinkel J, Kavi Kumar KS, Klein R (2009). Towards a formal framework of vulnerability to climate change. Environmental Modeling & Assessment. 14(1): 1-16. [Link] [DOI:10.1007/s10666-008-9179-x]
15. IPCC (2014). Climate change 2014: Synthesis report. Geneva: Intergovernmental Panel on Climate Change. [Link]
16. Kazemirad L, Abedi R (2024). Assessment of ecotourism potential of Arasbaran forest using CPI bioclimatic index. Journal of Climate Research. [Persian] [Link]
17. Khaledi S, Karimi Y, Ebdali H, Mohammadi GH (2020). Analyze of comfort climate indexes and its relation to tourism in Tabriz. Sustainable Development of Geographical Environment. 1(1):73-81. [Persian] [Link]
18. Khalili Azandehi F, Ehteshami Zh (2014). Investigating the temporal conditions of tourism climate in Alasht using the nervous pressure index. Proceedings of the First National Conference on Green Tourism. Hamedan: Mofateh University. [Persian] [Link]
19. Liu LW, Pahrudin P, Tsai CY, Hao L (2024). Disaster, risk and crises in tourism and hospitality field: A pathway toward tourism and hospitality management framework for resilience and recovery process. Natural Hazards Research. [Link] [DOI:10.1016/j.nhres.2024.06.001]
20. Neuvonen M, Sievänen T, Fronzek S, Lahtinen I, Veijalainen N, Carter TR (2015). Vulnerability of cross-country skiing to climate change in Finland-An interactive mapping tool. Journal of Outdoor Recreation and Tourism. 11:64-79. [Link] [DOI:10.1016/j.jort.2015.06.010]
21. Polsky C, Neff R, Yarnal B (2007). Building comparable global change vulnerability assessments: The vulnerability scoping diagram. Global Environmental Change. 17(3-4):472-485. [Link] [DOI:10.1016/j.gloenvcha.2007.01.005]
22. Richardson RB, Witkowski K (2010). Economic vulnerability to climate change for tourism-dependent nations. Tourism Analysis. 15(3):315-330. [Link] [DOI:10.3727/108354210X12801550666105]
23. Roscher C, Fergus AJF, Petermann JS, Buchmann N, Schmid B, Schulze ED (2013). What happens to the sown species if a biodiversity experiment is not weeded?. Basic and Applied Ecology. 14(3):187-198. [Link] [DOI:10.1016/j.baae.2013.01.003]
24. Scott D, Gössling S, Hall CM (2012). International tourism and climate change. WIREs Climate Change. 3(3):213-232. [Link] [DOI:10.1002/wcc.165]
25. Shani A, Arad B (2014). Climate change and tourism: Time for environmental skepticism. Tourism Management. 44:82-85. [Link] [DOI:10.1016/j.tourman.2014.02.014]
26. Smit B, Wandel J (2006). Adaptation, adaptive capacity and vulnerability. Global Environmental Change. 16(3):282-292. [Link] [DOI:10.1016/j.gloenvcha.2006.03.008]
27. Watson JEM, Iwamura T, Butt N (2013). Mapping vulnerability and conservation adaptation strategies under climate change. Nature Climate Change. 3(11):989-994. [Link] [DOI:10.1038/nclimate2007]